Fig. 12.
Download original image
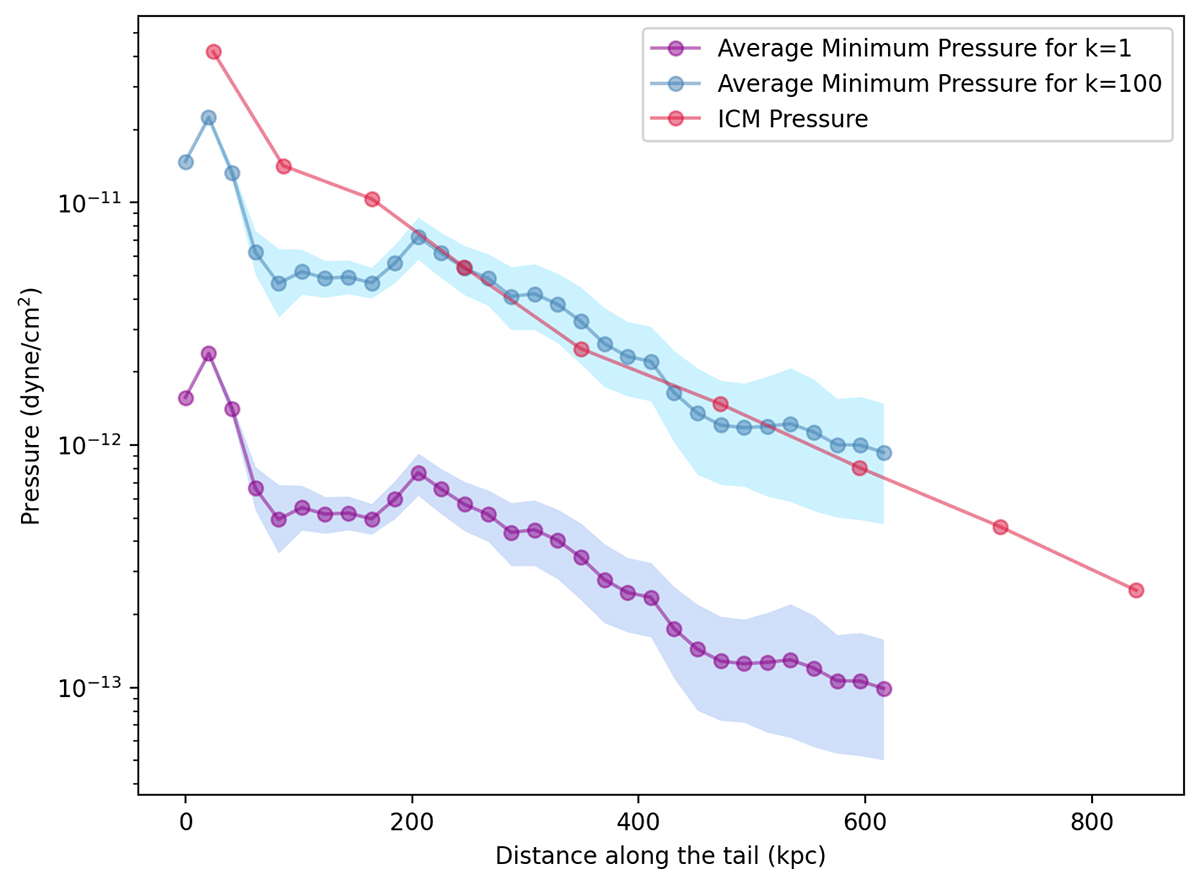
Three different profiles of pressure in dyne per square centimetre over the distance along the tail in kiloparsecs. The violet profile is the average profile of minimum pressure assuming k = 1 between low-resolution images at three frequencies, LOFAR at 144 MHz and uGMRT at 400 MHz and 650 MHz. The shaded area is the minimum and maximum of all three profiles. The blue profile is similar to the violet one but assumes k = 100. The red profile is the external ICM profile inferred from XMM-Newton observations.
Current usage metrics show cumulative count of Article Views (full-text article views including HTML views, PDF and ePub downloads, according to the available data) and Abstracts Views on Vision4Press platform.
Data correspond to usage on the plateform after 2015. The current usage metrics is available 48-96 hours after online publication and is updated daily on week days.
Initial download of the metrics may take a while.