Fig. 11.
Download original image
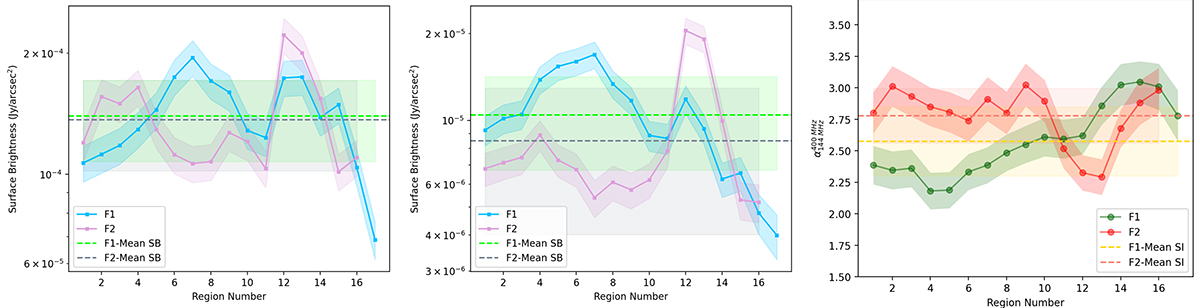
High-resolution surface brightness and spectral index trends for filaments F1 and F2. The left panel shows the surface brightness profiles of the LOFAR image at 144 MHz, followed by the uGMRT image profiles at 400 MHz in the middle panel. In the right panel, we show the spectral index profiles of filaments F1 and F2, computed from high-resolution images between LOFAR at 144 MHz and uGMRT at 400 MHz. The horizontal dashed lines represent the mean values, while the squared shaded areas represent the corresponding standard deviation. The flux density was extracted from circular regions of high-resolution images, as is depicted in Fig. 10.
Current usage metrics show cumulative count of Article Views (full-text article views including HTML views, PDF and ePub downloads, according to the available data) and Abstracts Views on Vision4Press platform.
Data correspond to usage on the plateform after 2015. The current usage metrics is available 48-96 hours after online publication and is updated daily on week days.
Initial download of the metrics may take a while.