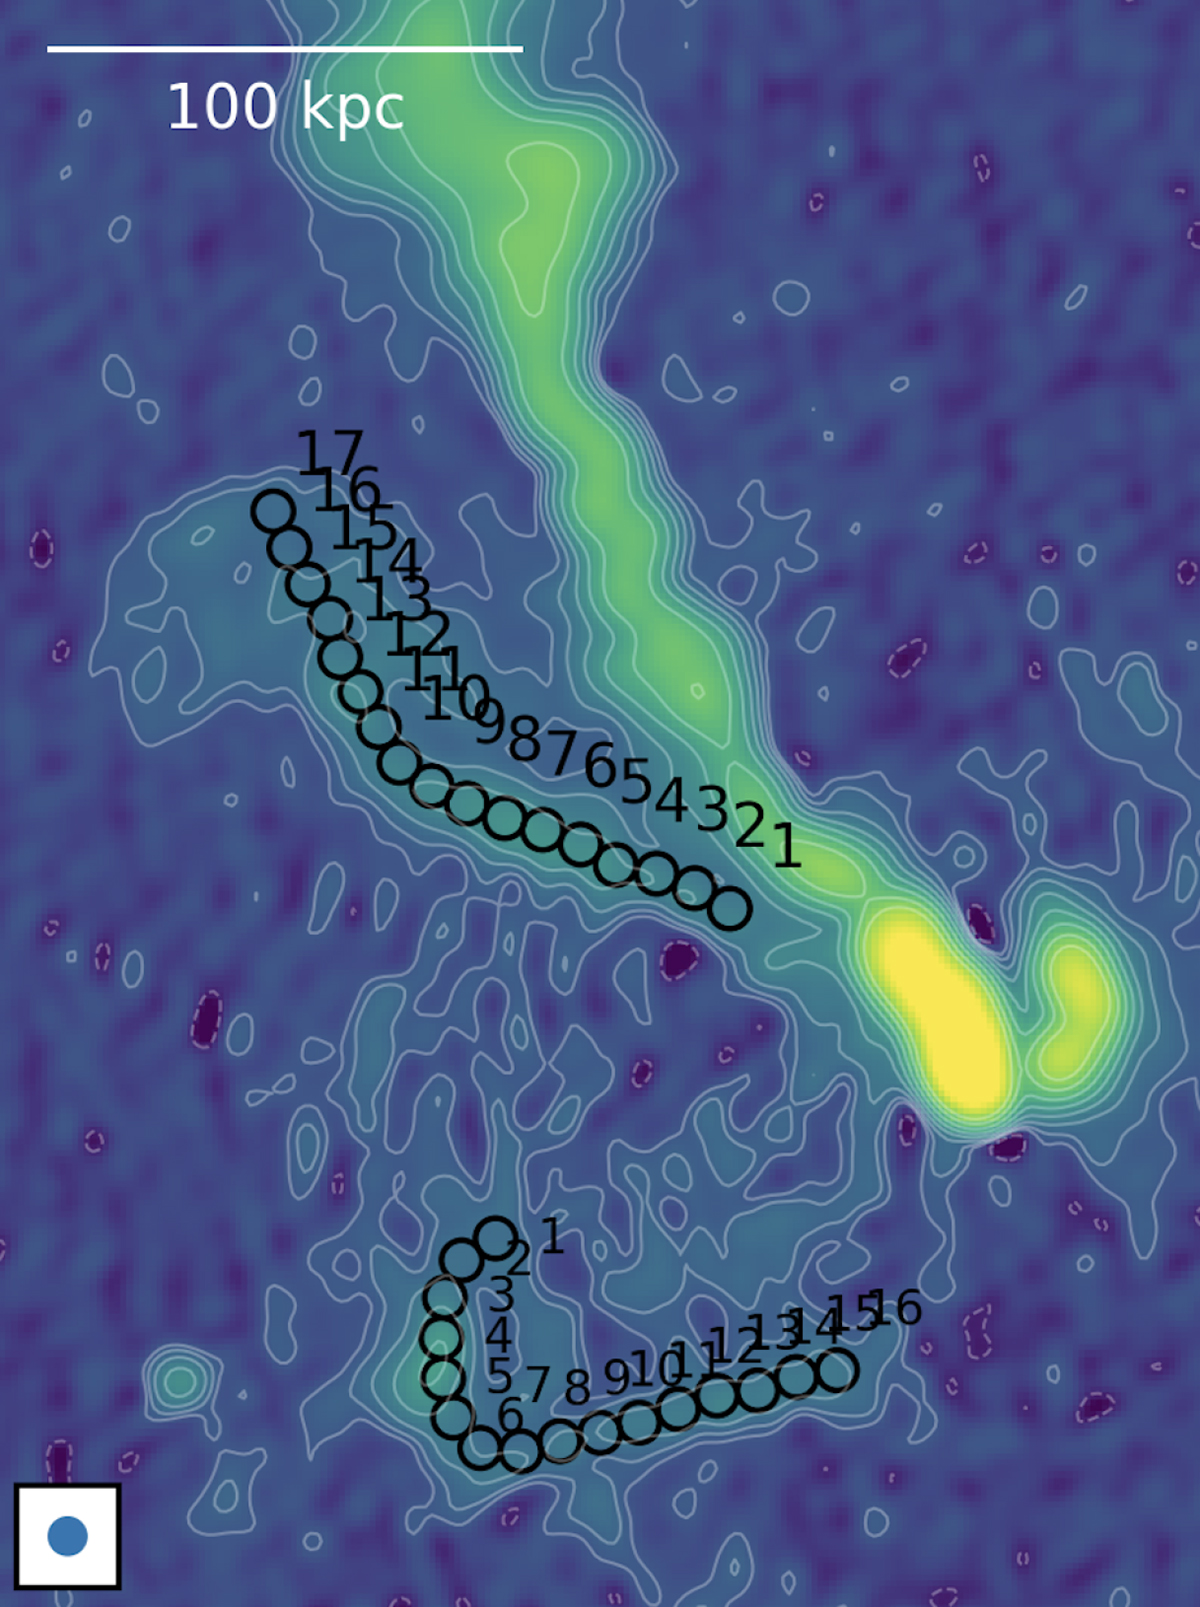
Fig. 10.
Download original image
Circular beam-sized regions with a diameter of 6″ were drawn based on high-resolution images for both filaments F1 and F2, using a 3σ emission threshold. Both filament regions start from 1; F1 has 17 regions, while F2 has 16. These regions are overlaid in the uGMRT band 3 high-resolution image and the beam is shown in the bottom left corner.
Current usage metrics show cumulative count of Article Views (full-text article views including HTML views, PDF and ePub downloads, according to the available data) and Abstracts Views on Vision4Press platform.
Data correspond to usage on the plateform after 2015. The current usage metrics is available 48-96 hours after online publication and is updated daily on week days.
Initial download of the metrics may take a while.