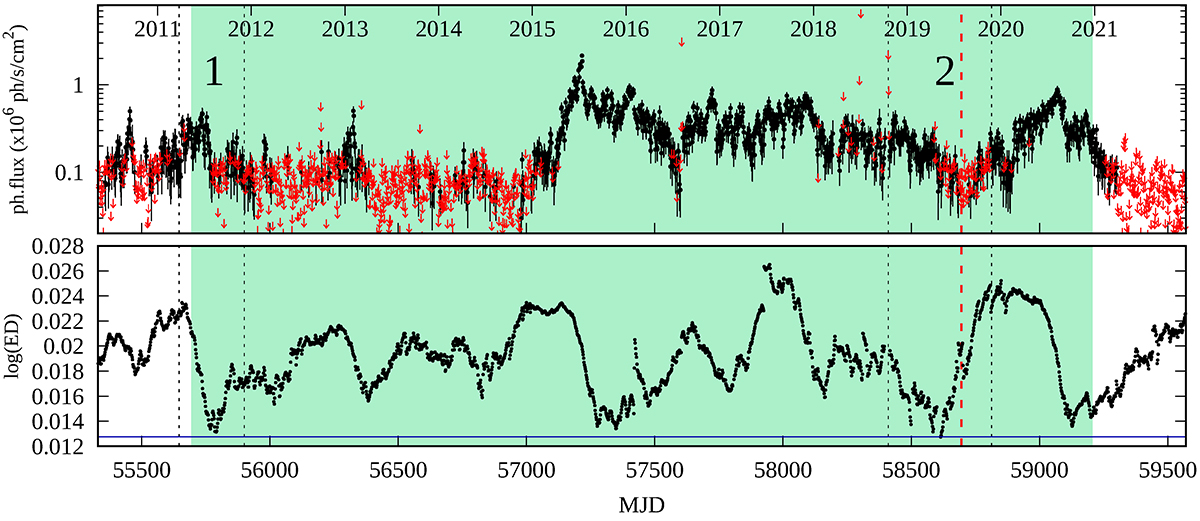
Fig. A.1.
Download original image
Assessment of the randomness of similarity between two intervals of the γ-ray light curve of PKS 1502+106. Top panel: Photon flux light curve with 3.35-day binning. Bottom panel: Euclidean distance between interval 1 of the curve with a 2.11 d binning, stretched by a factor of 1/0.63, and the entire γ-ray light curve in the top panel after scanning across it. The numbered intervals between the vertical dashed lines represent intervals where the γ-ray curve shows the repeated pattern. The blue horizontal line corresponds to the minimal value in the Euclidean distance curve, which is located in the middle of interval 2. The red dashed line indicates the detection moment of IC190730A neutrino event.
Current usage metrics show cumulative count of Article Views (full-text article views including HTML views, PDF and ePub downloads, according to the available data) and Abstracts Views on Vision4Press platform.
Data correspond to usage on the plateform after 2015. The current usage metrics is available 48-96 hours after online publication and is updated daily on week days.
Initial download of the metrics may take a while.