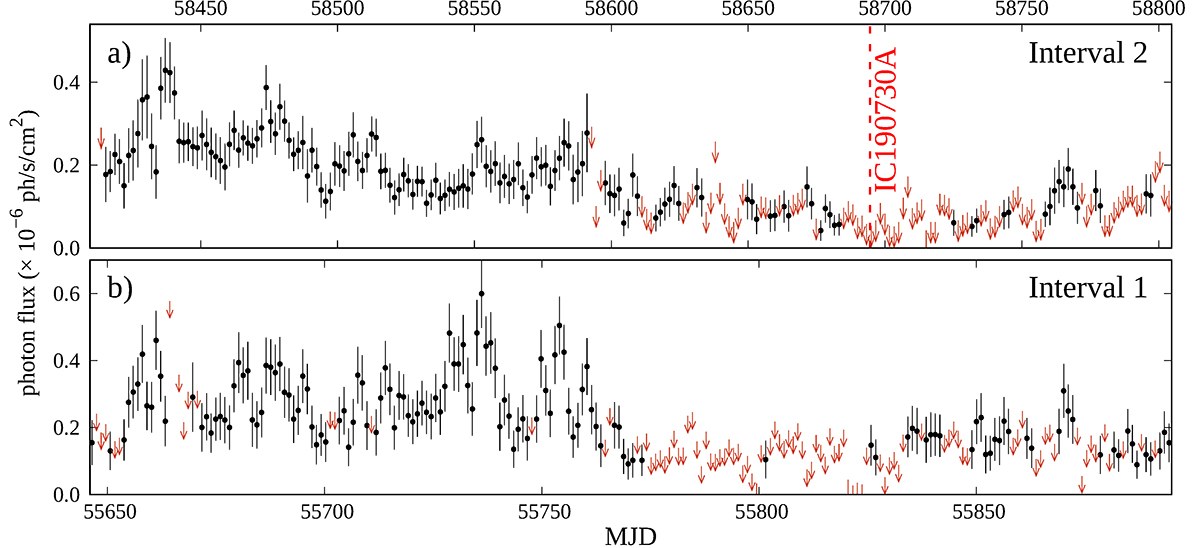
Fig. 1.
Download original image
Two intervals of the γ-ray light curve of PKS 1502+106 exhibiting the repeated pattern of flares for: a) Interval between 18 October 2018 and 17 November 2019, processed with a 3.35 d integration; b) Interval between 26 March 2011 and 30 November 2011, processed with a 2.11 d integration. Both curves are over-sampled in such a way that the time difference between two consecutive points equals half of the integration time. The dashed red line marks the arrival time of IC190730A.
Current usage metrics show cumulative count of Article Views (full-text article views including HTML views, PDF and ePub downloads, according to the available data) and Abstracts Views on Vision4Press platform.
Data correspond to usage on the plateform after 2015. The current usage metrics is available 48-96 hours after online publication and is updated daily on week days.
Initial download of the metrics may take a while.