Fig. 2
Download original image
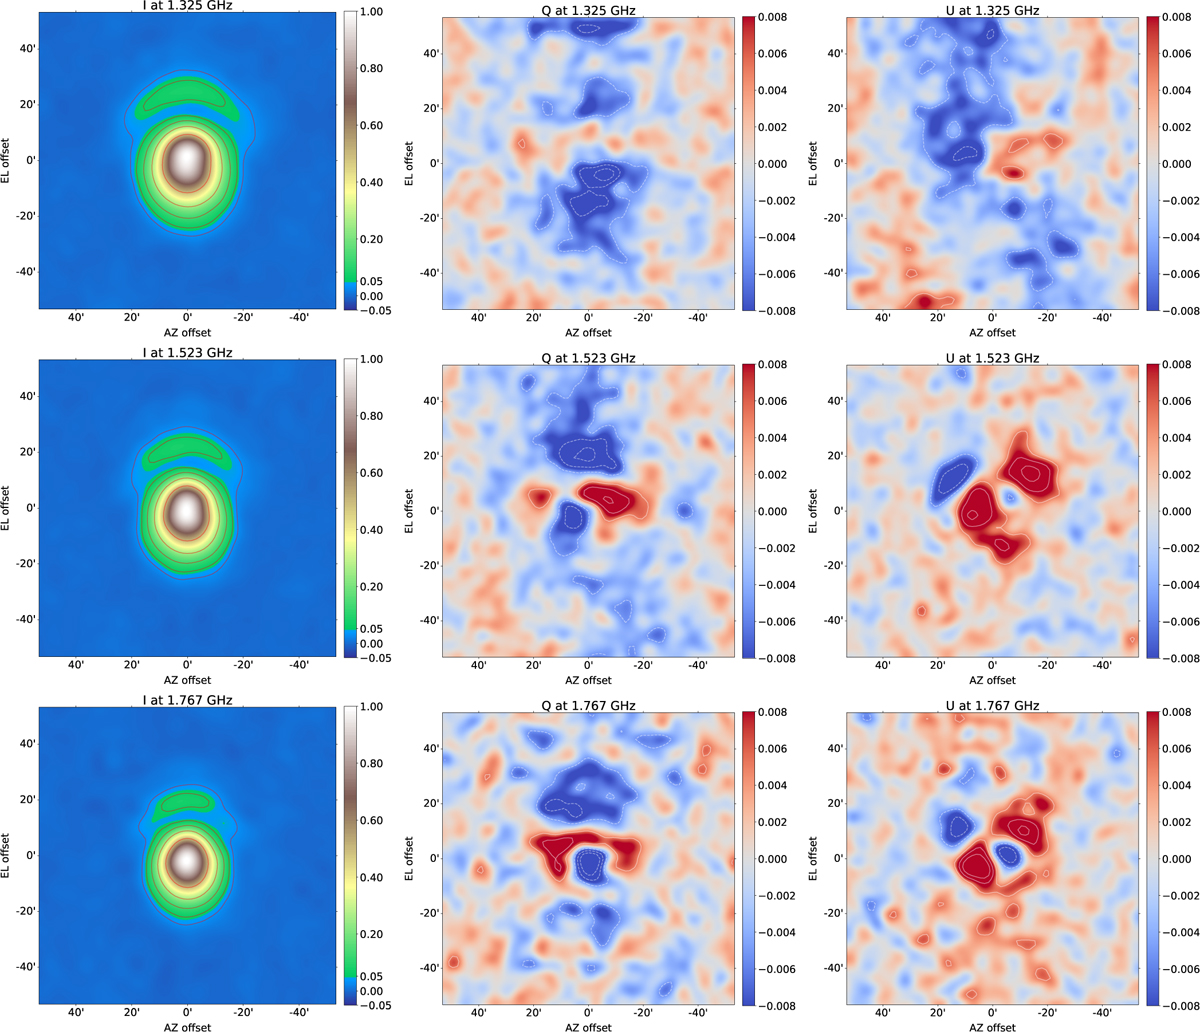
Beam patterns for I, Q, and U at three frequencies constructed from calibrated scans. The Q and U patterns represent leakage from I. All the patterns are normalized to the total intensity peaks. The contour levels for I start at −3 dB and stop at −15 dB with an interval of 3 dB. For Q and U, the contour levels start at −0.015 and stop at 0.015, with an interval of 0.005.
Current usage metrics show cumulative count of Article Views (full-text article views including HTML views, PDF and ePub downloads, according to the available data) and Abstracts Views on Vision4Press platform.
Data correspond to usage on the plateform after 2015. The current usage metrics is available 48-96 hours after online publication and is updated daily on week days.
Initial download of the metrics may take a while.