Open Access
Fig. A.1
Download original image
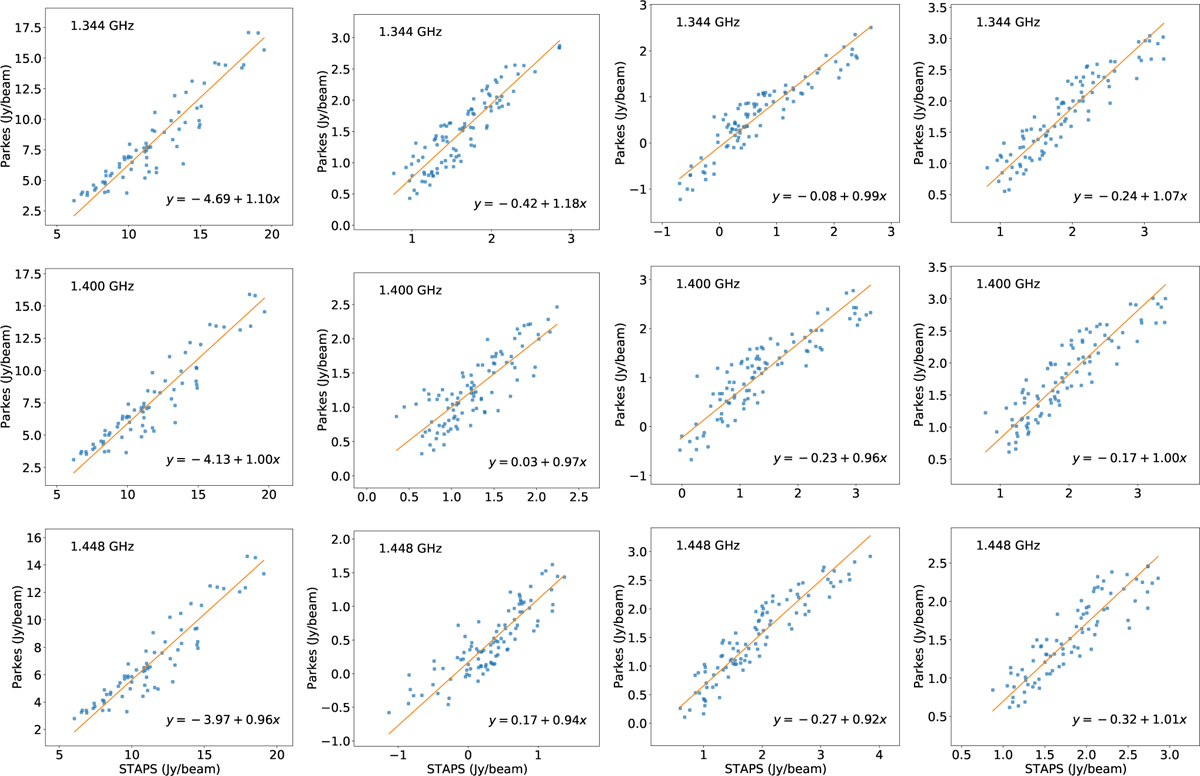
Comparison of pixel densities of Cen A between STAPS and the Parkes observation by O’Sullivan et al. (2013) at three frequencies (from top to bottom). From left to right are: I, Q, U, and polarized intensity. The solid lines indicate linear fits.
Current usage metrics show cumulative count of Article Views (full-text article views including HTML views, PDF and ePub downloads, according to the available data) and Abstracts Views on Vision4Press platform.
Data correspond to usage on the plateform after 2015. The current usage metrics is available 48-96 hours after online publication and is updated daily on week days.
Initial download of the metrics may take a while.