Fig. 10
Download original image
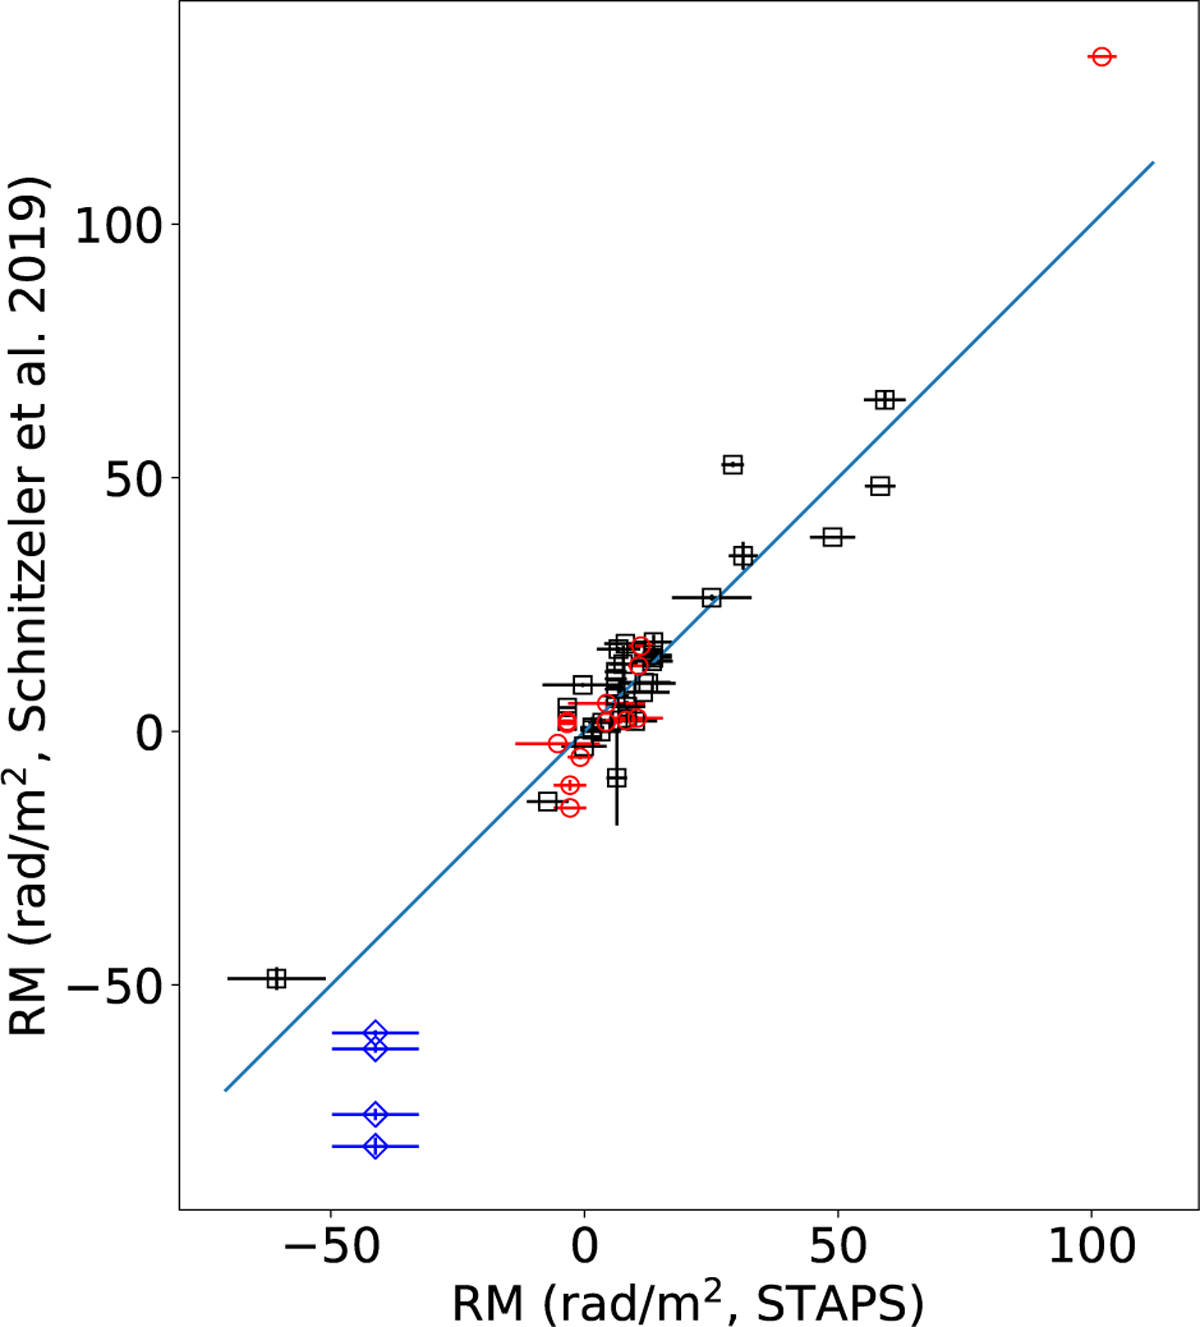
Comparison of RMs derived from STAPS and the measurements by Schnitzeler et al. (2019). The sources with only one RM component in Schnitzeler et al. (2019) are marked with red circles. For sources with multiple RM components, the RMs of the first components are plotted and marked with black squares. For the one source with multiple observations, the RMs of the second components are plotted and marked with blue diamonds. The line indicates y = x.
Current usage metrics show cumulative count of Article Views (full-text article views including HTML views, PDF and ePub downloads, according to the available data) and Abstracts Views on Vision4Press platform.
Data correspond to usage on the plateform after 2015. The current usage metrics is available 48-96 hours after online publication and is updated daily on week days.
Initial download of the metrics may take a while.