Fig. 1.
Download original image
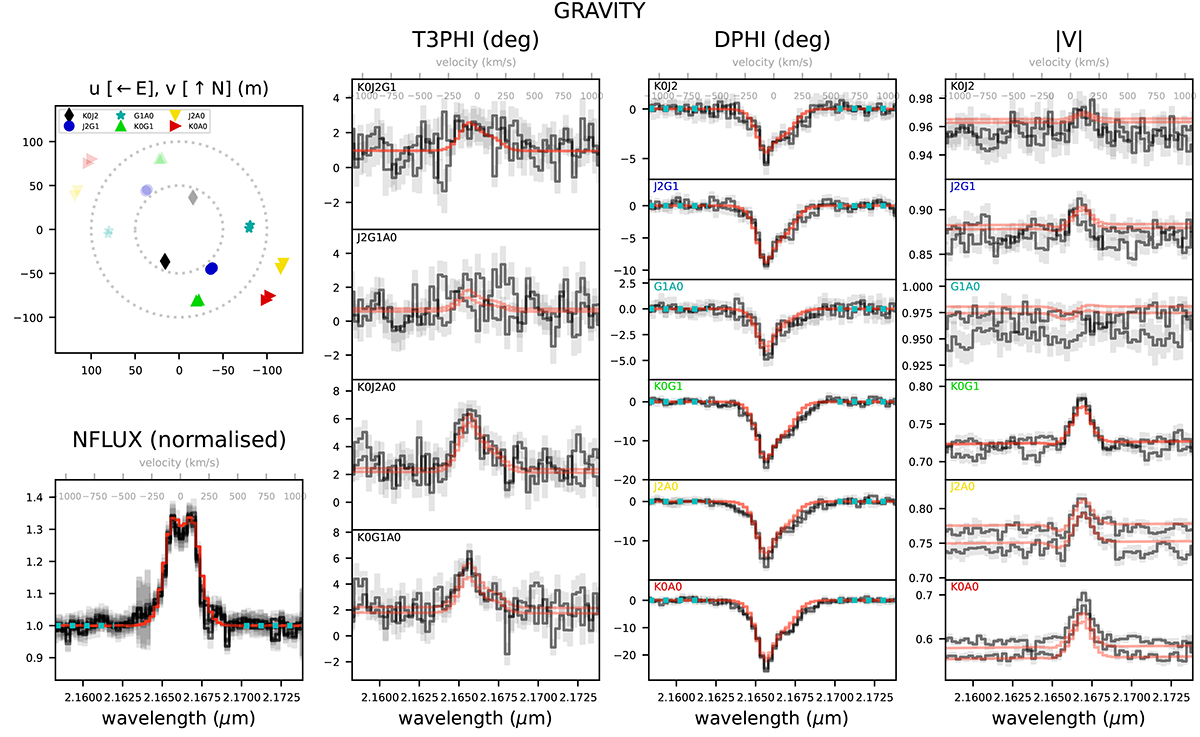
PMOIRED Keplerian geometrical model fit to the calibrated GRAVITY snapshot taken on 2023 July 17, representing the average quality of the model fit (χ2 = 3.1) as well as the typical quality of the data. The upper-left panel shows the (u, v) coverage, the lower-left panel the normalized Brγ line profile (NFLUX), and the remaining panels the interferometric observables closure phase (T3PHI), differential phase (DPHI), and the absolute visibility (|V|). The data (black with gray error bars) are overplotted with the model fit (red). The blue dots in the NFLUX and DPHI panels represent the continuum region used for normalization. The baselines and telescope triangles are given in the corner of each panel, and their colors correspond to the (u, v) coverage panel. For the layout of the VLTI telescope locations, see Fig. 10 in the VLTI manual (https://www.eso.org/sci/facilities/paranal/telescopes/vlti/documents/VLT-MAN-ESO-15000-4552_v115.pdf).
Current usage metrics show cumulative count of Article Views (full-text article views including HTML views, PDF and ePub downloads, according to the available data) and Abstracts Views on Vision4Press platform.
Data correspond to usage on the plateform after 2015. The current usage metrics is available 48-96 hours after online publication and is updated daily on week days.
Initial download of the metrics may take a while.