Fig. 2
Download original image
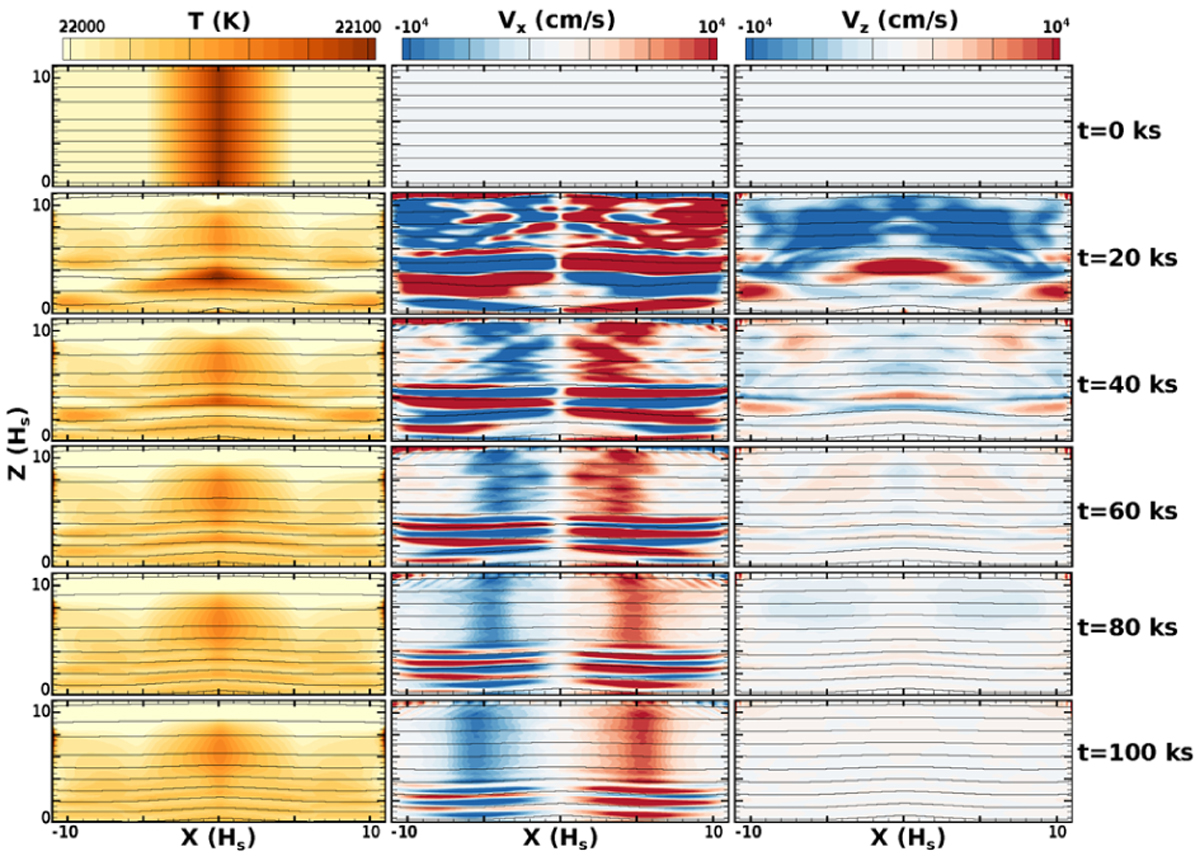
Time evolution of the standard magnetic model with an initial uniform 10 G magnetic field (black lines) in the horizontal direction. The top row shows the initial time snapshot, with subsequent time snap-shots taken every 20 ks. The left column shows the temperature in kelvins, the middle column shows the horizontal flow velocity, and the right column shows the vertical flow velocity in cm s−1. Note that the range for velocity is a factor of 10 lower than for the non-magnetic case in Fig. 1. This highlights the effects the magnetic field can have on atmospheric flow.
Current usage metrics show cumulative count of Article Views (full-text article views including HTML views, PDF and ePub downloads, according to the available data) and Abstracts Views on Vision4Press platform.
Data correspond to usage on the plateform after 2015. The current usage metrics is available 48-96 hours after online publication and is updated daily on week days.
Initial download of the metrics may take a while.