Fig. 1
Download original image
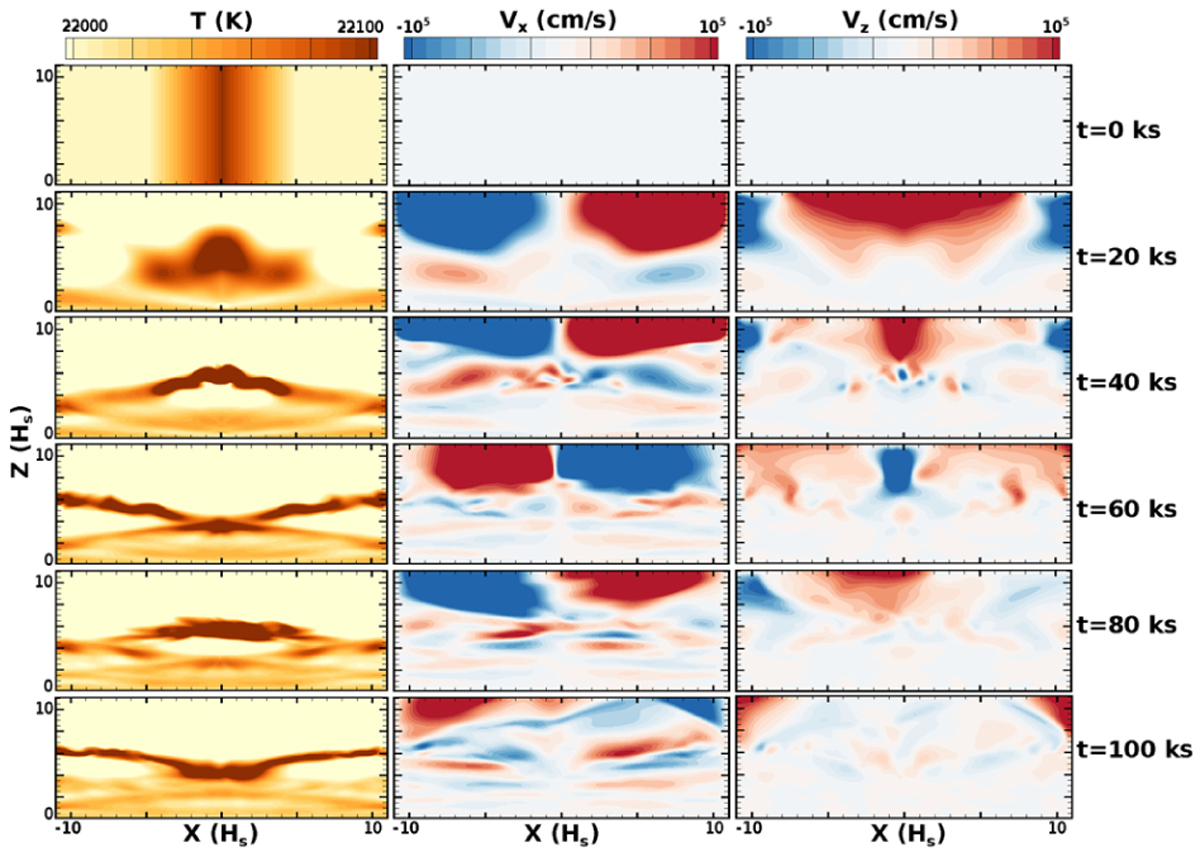
Time evolution of the non-magnetic model. The top row shows the initial snapshot, with subsequent time snapshots taken every 20 ks. The left column shows the temperature in kelvins, the middle column shows the horizontal flow velocity, and the right column shows the vertical flow velocity in cm s−1. Red colour in the middle panel represents lateral motion of the gas to the right and blue represents motion to the left. Likewise, the red colour in the right panel represents upward flow while blue represents downward motion.
Current usage metrics show cumulative count of Article Views (full-text article views including HTML views, PDF and ePub downloads, according to the available data) and Abstracts Views on Vision4Press platform.
Data correspond to usage on the plateform after 2015. The current usage metrics is available 48-96 hours after online publication and is updated daily on week days.
Initial download of the metrics may take a while.