Fig. 5.
Download original image
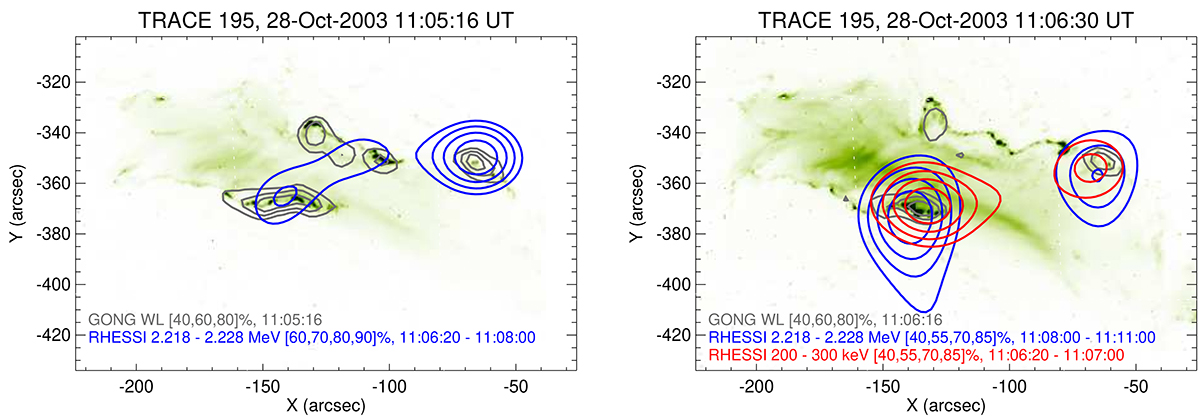
Multiwavelength imaging overview of the October 23, 2003, event at two different times. In both panels, the TRACE 195 Å image is plotted as a green background, with gray contours representing flare ribbons derived from pre-flare subtracted GONG intensity images. Red contours indicate RHESSI HXR images, while blue contours show RHESSI γ-ray images. The left panel depicts a time near the impulsive phase peak, and the right panel illustrates a time during the decaying impulsive phase. The time integration intervals for the RHESSI γ-ray images have been adjusted based on the contribution of the different flare phases to the neutron-capture line (see Sect. 3 for details).
Current usage metrics show cumulative count of Article Views (full-text article views including HTML views, PDF and ePub downloads, according to the available data) and Abstracts Views on Vision4Press platform.
Data correspond to usage on the plateform after 2015. The current usage metrics is available 48-96 hours after online publication and is updated daily on week days.
Initial download of the metrics may take a while.