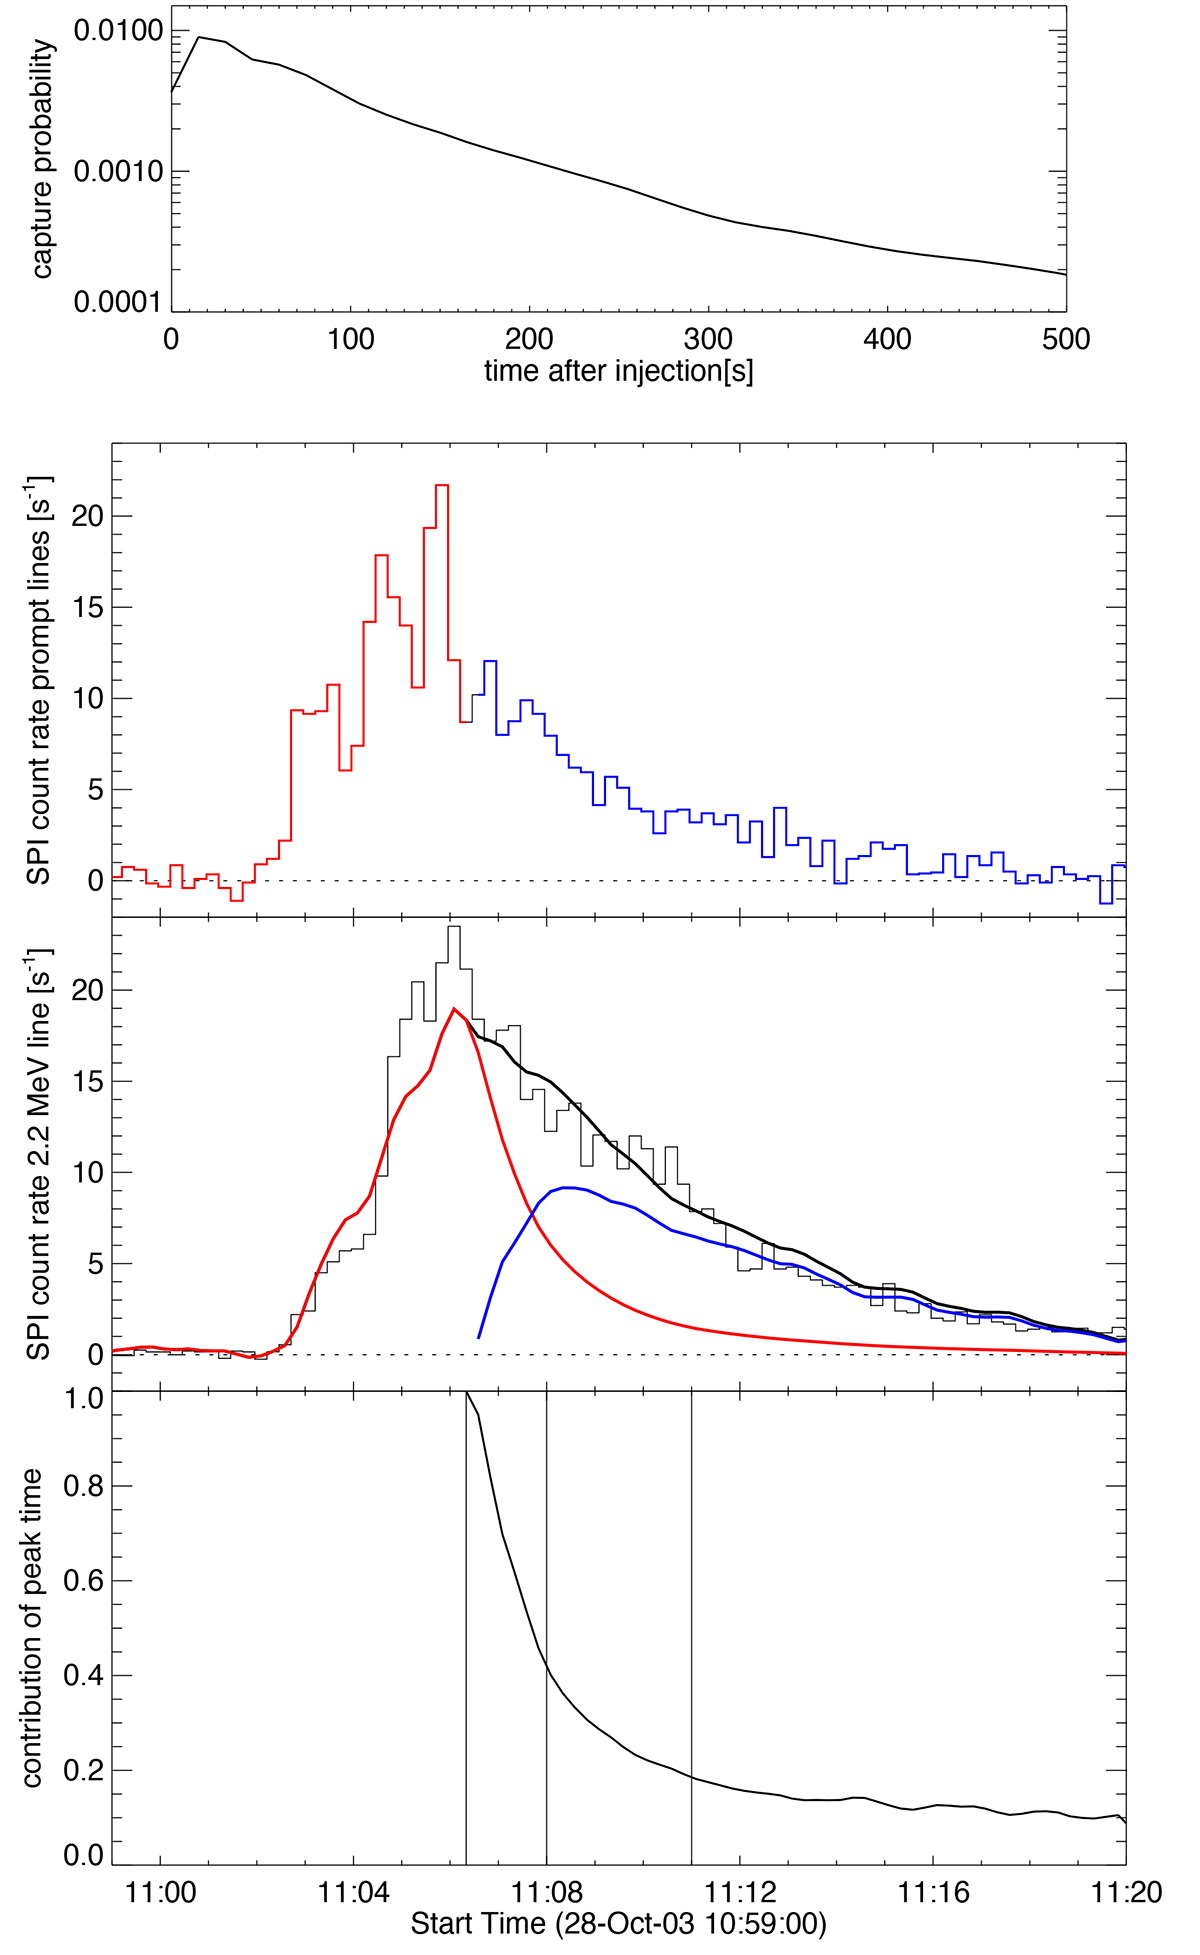
Fig. 4.
Download original image
Relative timing of proton precipitation and creation of the 2.223 MeV neutron-capture line emission. (Top panel) Time profile of the 2.223 MeV line emission, assuming a δ-function injection of protons at time zero (for details, see Murphy et al. 2003). (Second panel) Time profiles of the INTEGRAL/SPI prompt lines, which is the same as the black curve in Fig. 1. Red indicates periods when RHESSI was not observing (peak of the impulsive phase), while blue highlights RHESSI observation times (decaying impulsive phase). (Third panel) Time profiles of the INTEGRAL/SPI 2.223 MeV neutron-capture line (black histogram). Red indicates the contribution to the 2.223 MeV neutron-capture line of the times prior to RHESSI observations, and hence the peak of the impulsive phase, while blue indicates the contribution from the decaying impulsive phase. (Bottom panel) Relative contribution to the 2.223 MeV neutron-capture line from the peak of the impulsive phase as a function of time, calculated from the ratio of the black curve in the middle panel divided by the red one. The vertical lines give the edges of the time intervals used for the images presented in Fig. 5.
Current usage metrics show cumulative count of Article Views (full-text article views including HTML views, PDF and ePub downloads, according to the available data) and Abstracts Views on Vision4Press platform.
Data correspond to usage on the plateform after 2015. The current usage metrics is available 48-96 hours after online publication and is updated daily on week days.
Initial download of the metrics may take a while.