Fig. 3.
Download original image
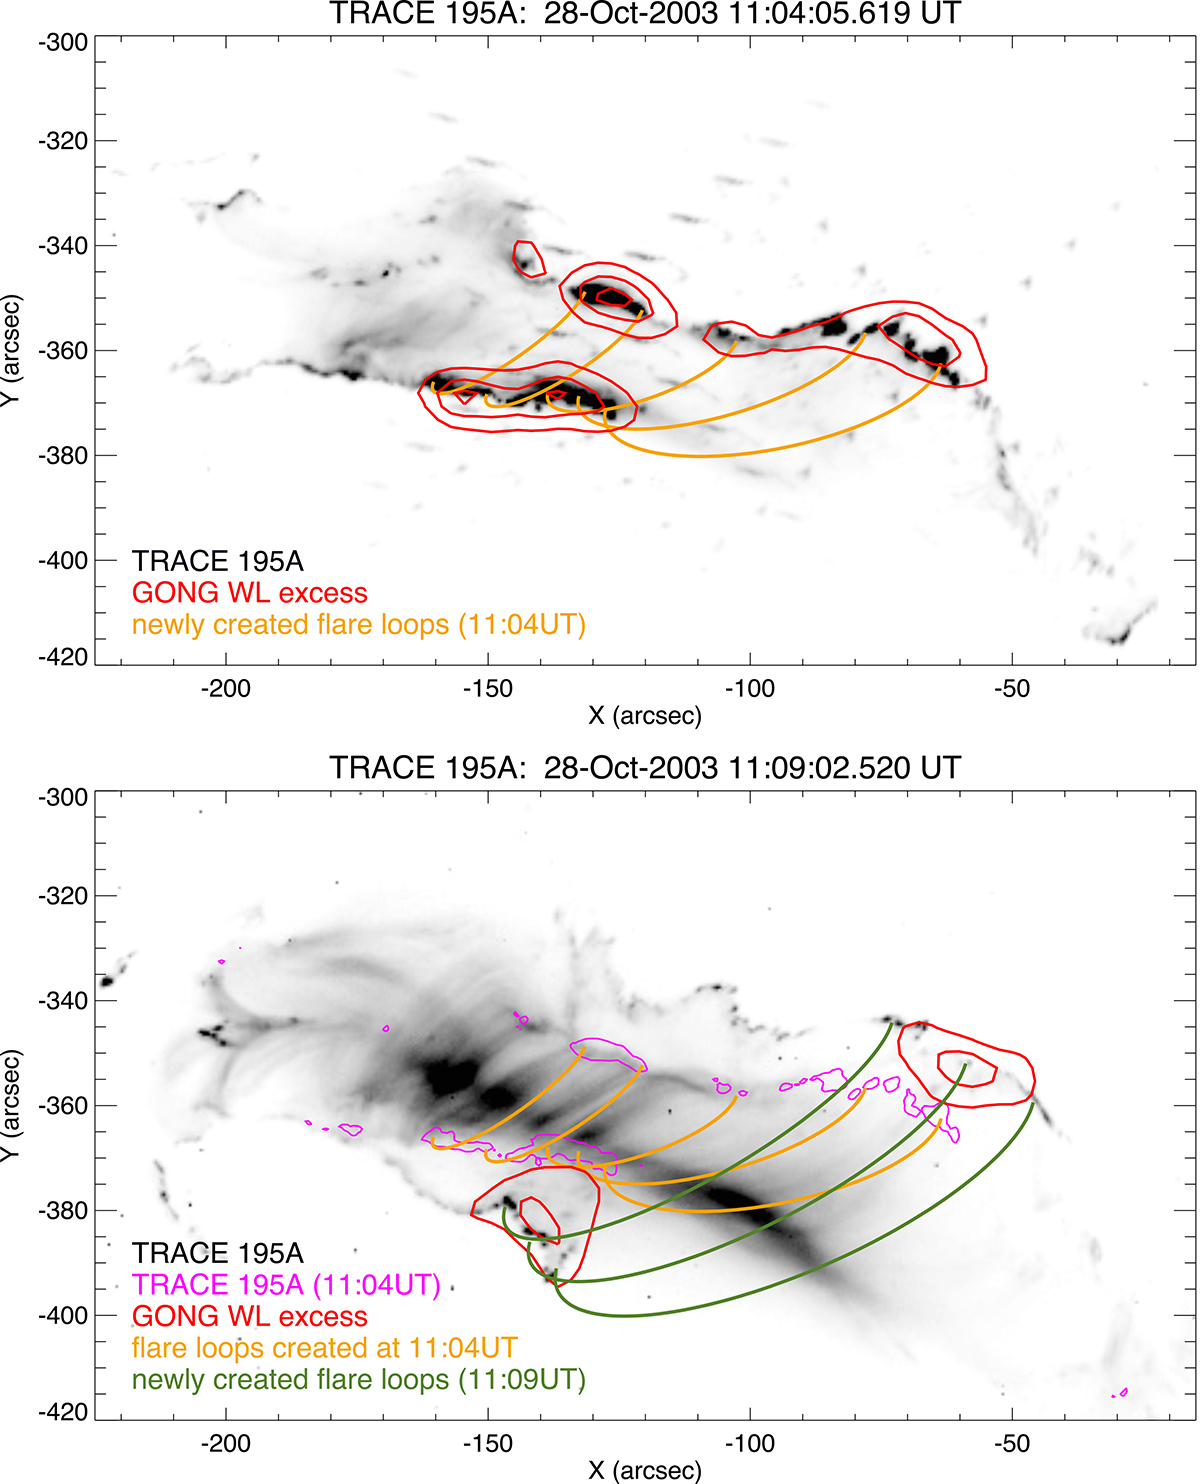
EUV and WL images of the flare at two different time instances. In both panels, the TRACE 195 Å image is plotted as the background, with red contours overlaid to indicate the flare ribbons derived from pre-flare subtracted GONG intensity images (see Fig. 2). The two different times correspond to a time near the peak of the impulsive phase (top) and a time during the decay phase (bottom). To represent the flare loops connected to the ribbons, we draw as a proxy semicircles perpendicular to the solar surface, where yellow semicircles denote flare loops formed during the impulsive phase, while the green ones represent flare loops created during the decay phase. The selection of the footpoints for the proxy loops was driven to have several loops along the ribbons connecting the WL sources without much twist in them. The selection is somewhat arbitrary and intended as a visual guide.
Current usage metrics show cumulative count of Article Views (full-text article views including HTML views, PDF and ePub downloads, according to the available data) and Abstracts Views on Vision4Press platform.
Data correspond to usage on the plateform after 2015. The current usage metrics is available 48-96 hours after online publication and is updated daily on week days.
Initial download of the metrics may take a while.