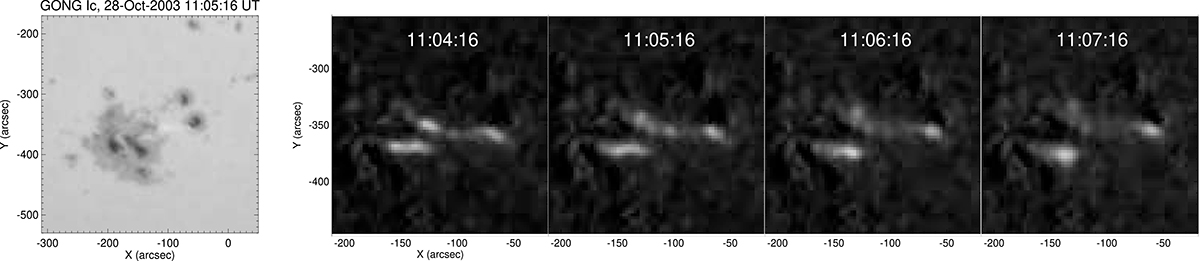
Fig. 2.
Download original image
Overview of the GONG intensity observations of the October 28, 2003, flare. The leftmost panel shows the continuum intensity image of the region where the flare happened. From the second to the fifth panel, we show the time evolution (around the peak of the impulsive phase at 1 minute time resolution) of the pre-flare subtracted continuum intensity images. From the pre-flare subtracted images, we can clearly see the flare ribbons. The percent level of the maximum increase in WL emission due to the flare is 35% of the pre-flare intensity.
Current usage metrics show cumulative count of Article Views (full-text article views including HTML views, PDF and ePub downloads, according to the available data) and Abstracts Views on Vision4Press platform.
Data correspond to usage on the plateform after 2015. The current usage metrics is available 48-96 hours after online publication and is updated daily on week days.
Initial download of the metrics may take a while.