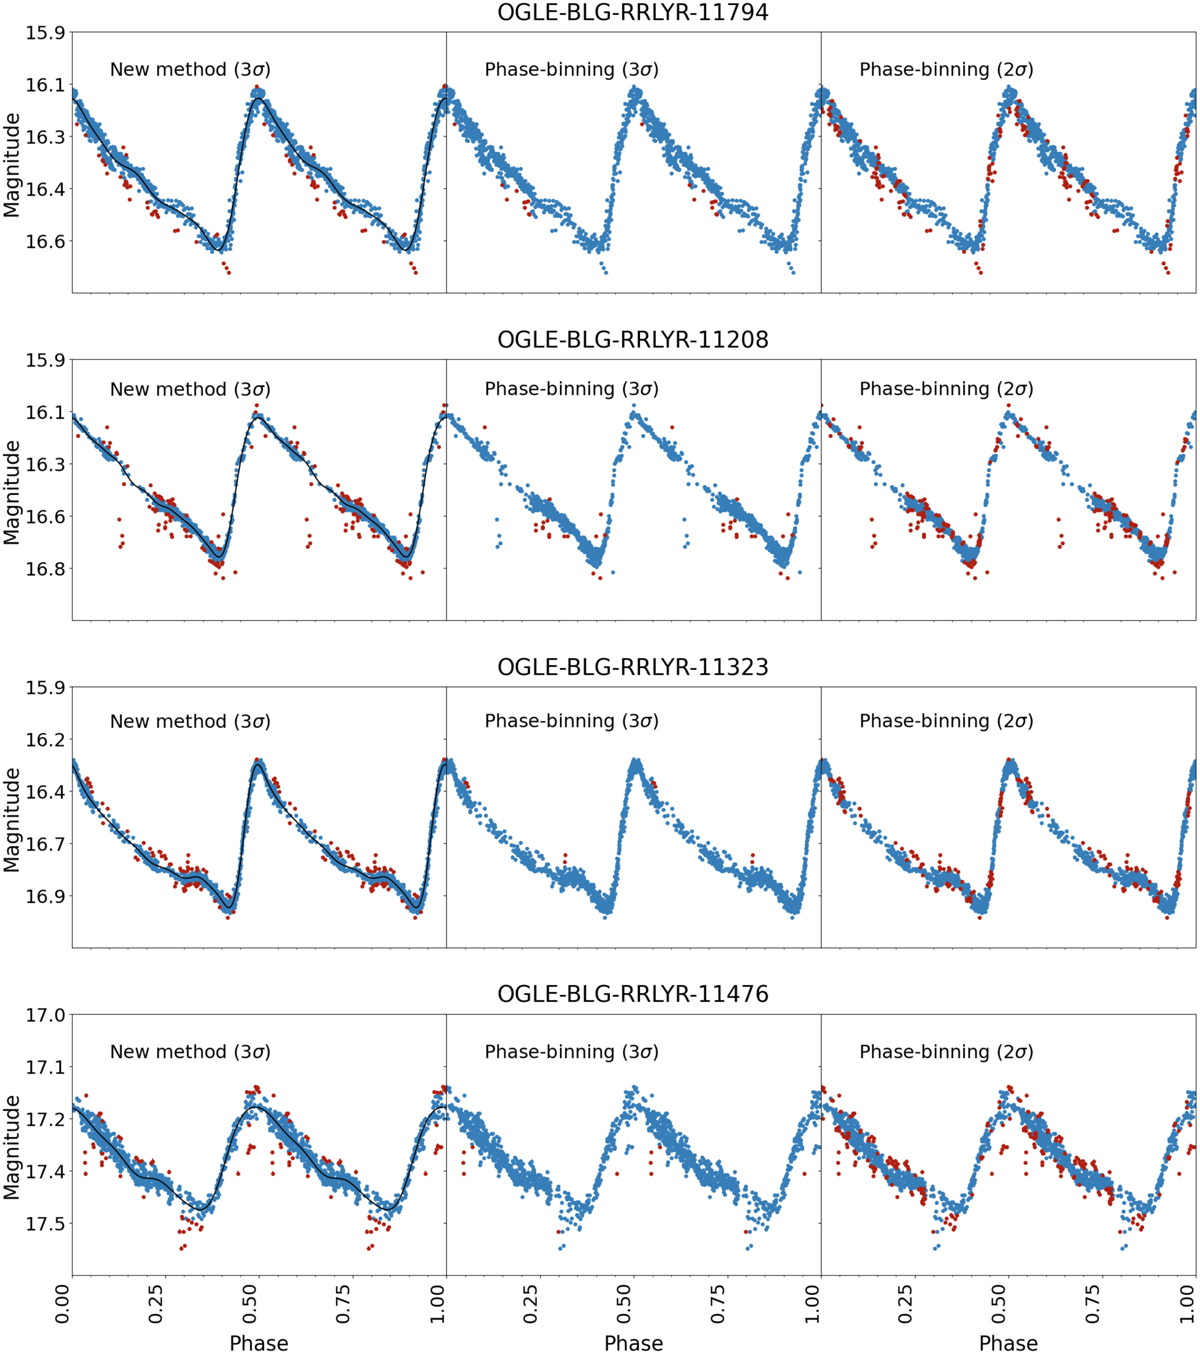
Fig. 4
Download original image
Example of the sigma-clipping technique proposed in this work for six RRab stars, where the black line depicts the Fourier fit in the r band. The yellow dots represent the remaining data points, and the red dots represent the data points removed using the 3σ threshold with five iterations (left panel). The central and right panel shows the phase-binning method using bins of 0.05 width (in phase) and a 3σ and 2σ threshold with five iterations, respectively.
Current usage metrics show cumulative count of Article Views (full-text article views including HTML views, PDF and ePub downloads, according to the available data) and Abstracts Views on Vision4Press platform.
Data correspond to usage on the plateform after 2015. The current usage metrics is available 48-96 hours after online publication and is updated daily on week days.
Initial download of the metrics may take a while.