Open Access
Fig. 13
Download original image
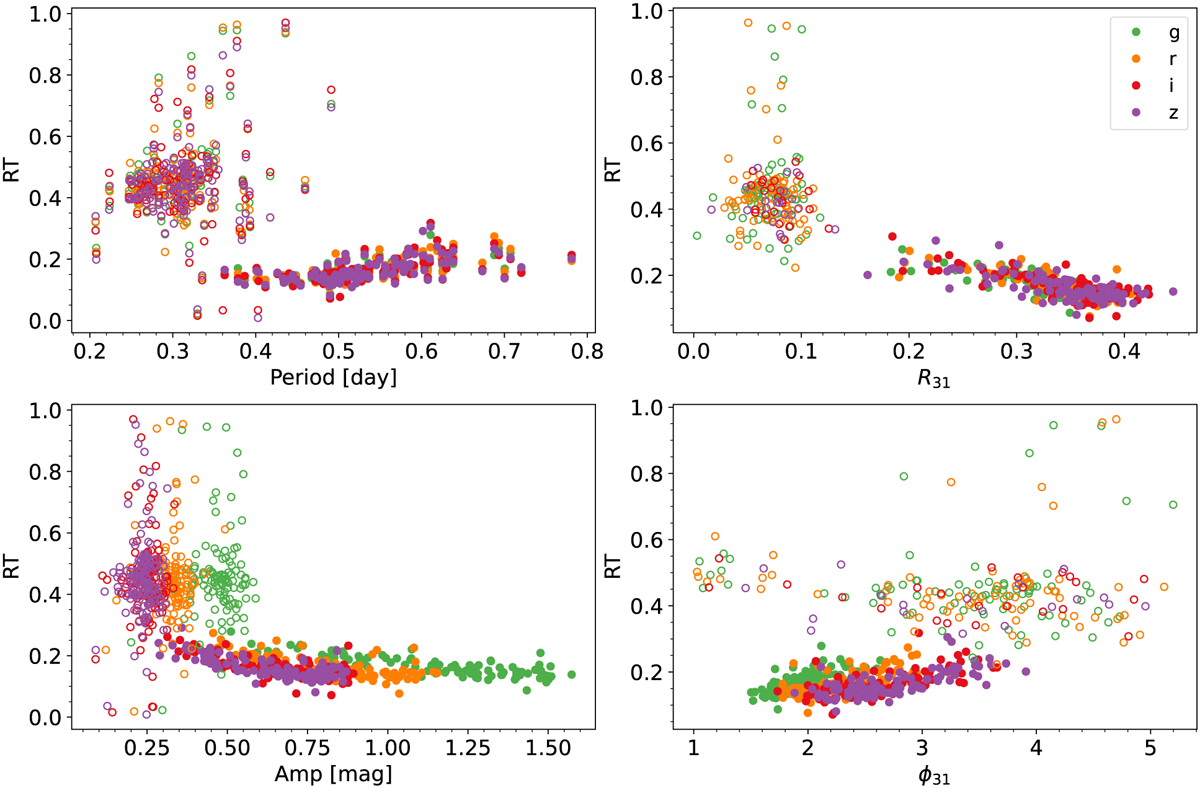
Rise time is shown in upper left panel plotted against the period. Upper right panel displays R31, lower left panel represents the total amplitude, and lower right panel depicts ϕ31 for RRab and RRc stars. The ɡriz bands are represented with the same symbols and color scheme as in Figure 11.
Current usage metrics show cumulative count of Article Views (full-text article views including HTML views, PDF and ePub downloads, according to the available data) and Abstracts Views on Vision4Press platform.
Data correspond to usage on the plateform after 2015. The current usage metrics is available 48-96 hours after online publication and is updated daily on week days.
Initial download of the metrics may take a while.