Open Access
Fig. 12
Download original image
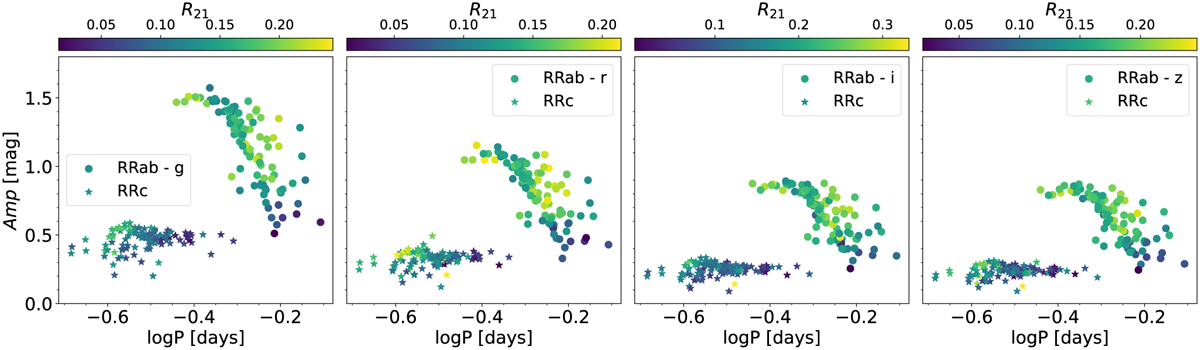
Total amplitude as a function of log(P) in (from left to right) the ɡriz bands for RRab and RRc stars, represented by circles and stars, respectively. The color of the symbols indicates the value of the Fourier parameter R21, as shown by the color bar at the top.
Current usage metrics show cumulative count of Article Views (full-text article views including HTML views, PDF and ePub downloads, according to the available data) and Abstracts Views on Vision4Press platform.
Data correspond to usage on the plateform after 2015. The current usage metrics is available 48-96 hours after online publication and is updated daily on week days.
Initial download of the metrics may take a while.