Fig. D.1
Download original image
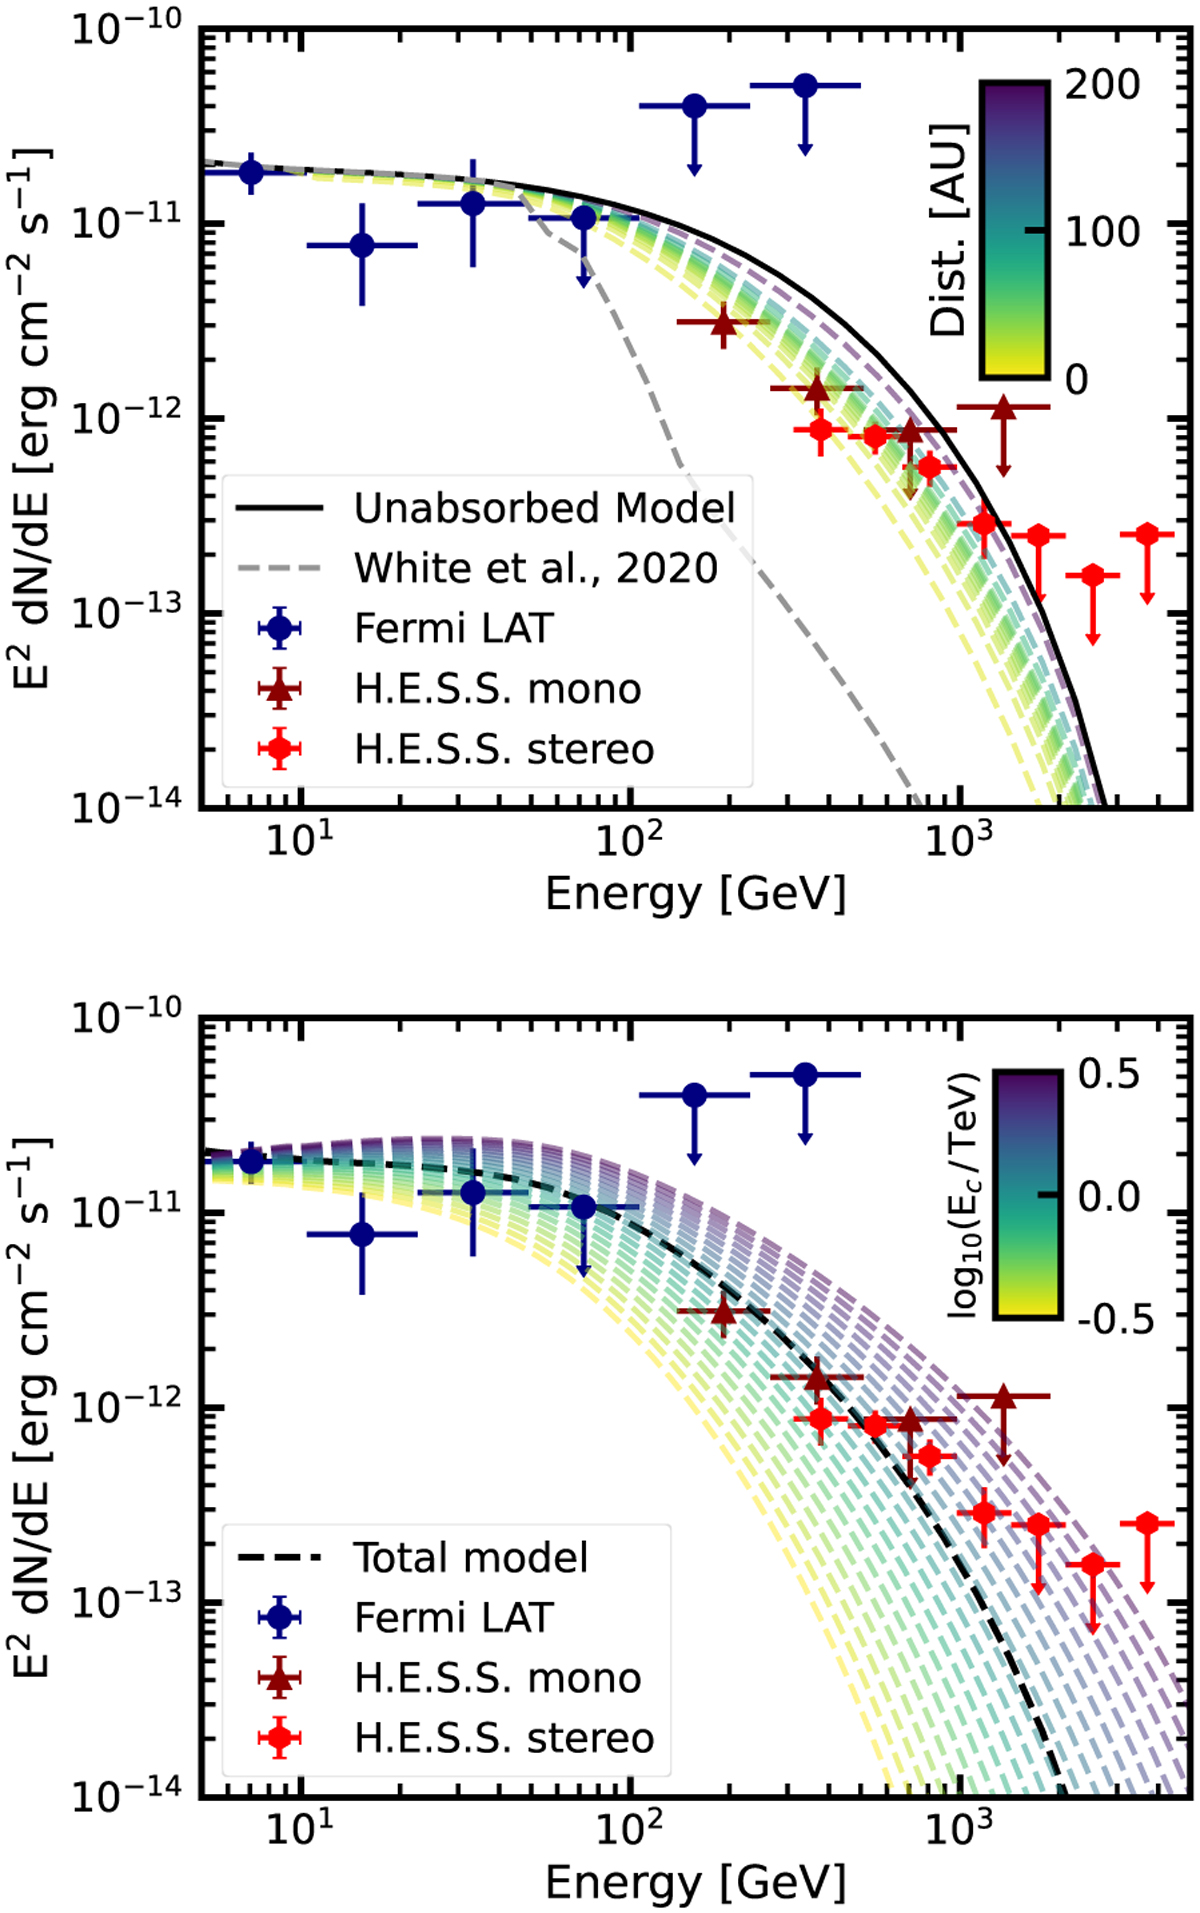
Model spectra for different emission regions and cut-off energies compared to the combined SED. Upper panel: The total predicted model flux for the periastron phase is compared to the data assuming different gamma-gamma absorption curves. For comparison, also the absorbed and unabsorbed model from White et al. (2020) (as also presented in Figure 4) is shown. The absorption in their model assumes gamma-ray production close to the shock cap. Lower panel: The cut-off energy, Ec, is varied, keeping the index and normalisation fixed. The cut-off energy was varied in 20 logarithmic bins between 0.32 and 3.2 TeV. The emission region was assumed to be at a distance of 20 au and the resulting absorption curve was used. The total model refers to the total emission from the original model without adapting Ec.
Current usage metrics show cumulative count of Article Views (full-text article views including HTML views, PDF and ePub downloads, according to the available data) and Abstracts Views on Vision4Press platform.
Data correspond to usage on the plateform after 2015. The current usage metrics is available 48-96 hours after online publication and is updated daily on week days.
Initial download of the metrics may take a while.