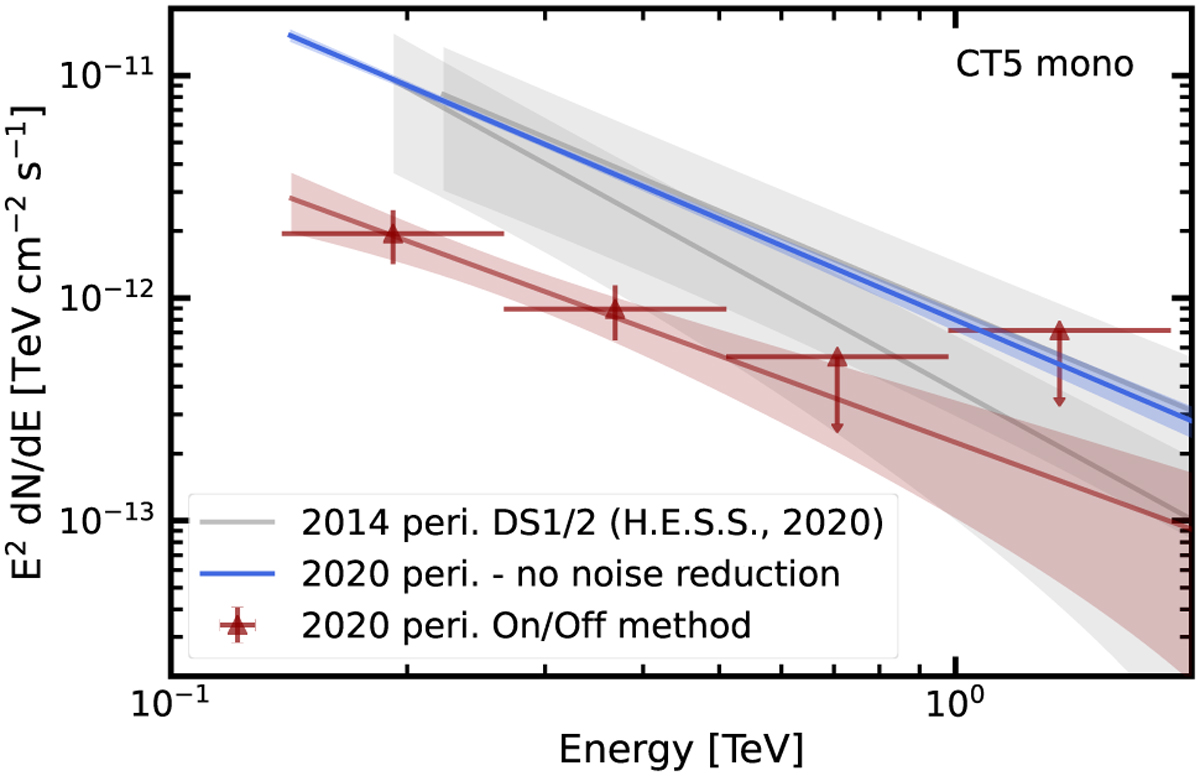
Fig. B.2
Download original image
The resulting SED from the on-off approach with flux points is compared to the spectral model derived from a reflected regions analysis without any special treatment to model the noise influence. The spectra from the datasets (DS) 1 and 2 taken around the 2014 periastron passage from H.E.S.S. Collaboration (2020) are also shown for comparison. The spectral models for the 2020 dataset (DS-C) only include statistical errors, whereas the 2014 spectra also include systematic errors as discussed in the paper.
Current usage metrics show cumulative count of Article Views (full-text article views including HTML views, PDF and ePub downloads, according to the available data) and Abstracts Views on Vision4Press platform.
Data correspond to usage on the plateform after 2015. The current usage metrics is available 48-96 hours after online publication and is updated daily on week days.
Initial download of the metrics may take a while.