Fig. 5
Download original image
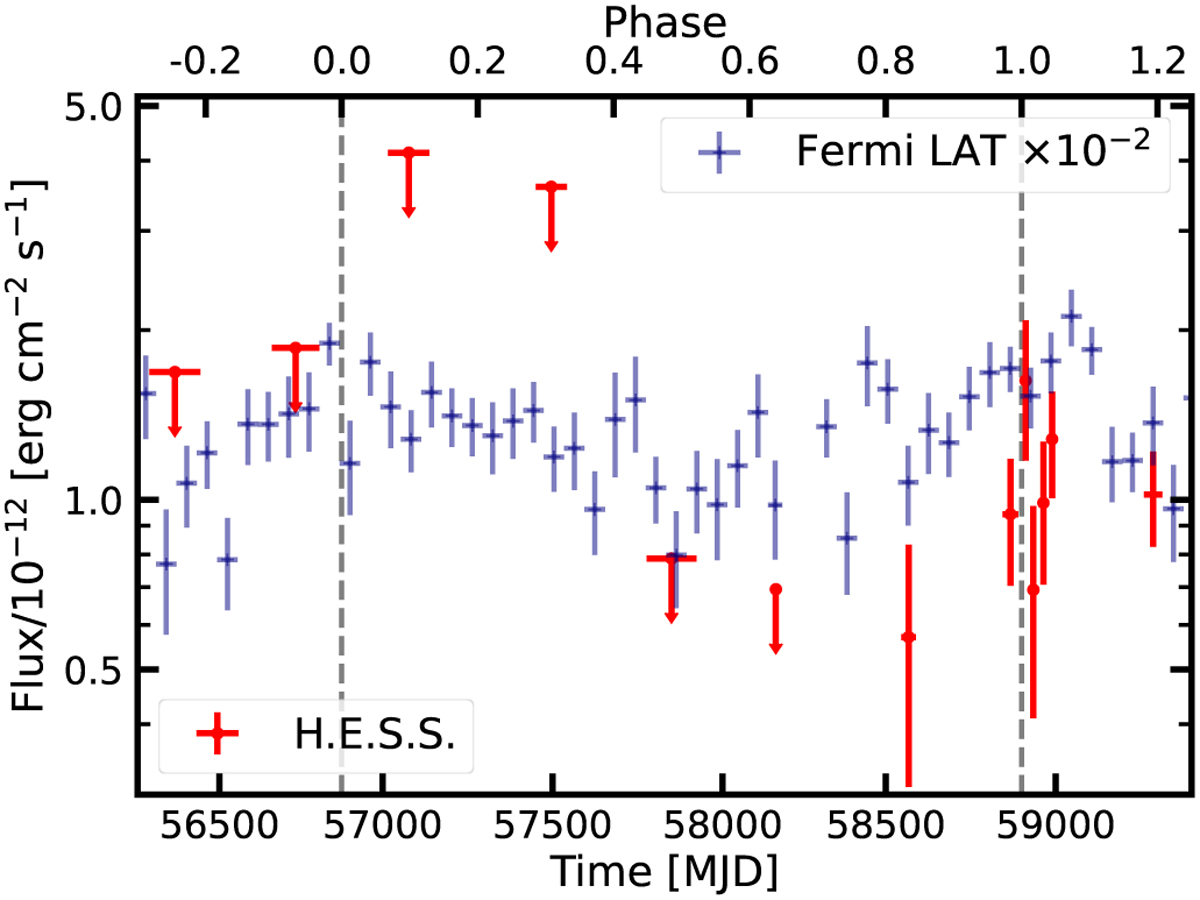
H.E.S.S. light curve (red) above 310 GeV derived from the stereo data in this work compared to the Fermi-LAT light curve (blue) above 100 MeV (scaled down with 10−2) with a bin size of ∼60 days. The dashed lines represent the periastron passages of 2014 and 2020 at phases 0 and 1, respectively. The error bars correspond to the 68% confidence interval and upper limits (at 95% confidence) were calculated for phase bins with a less than 2 σ detection significance.
Current usage metrics show cumulative count of Article Views (full-text article views including HTML views, PDF and ePub downloads, according to the available data) and Abstracts Views on Vision4Press platform.
Data correspond to usage on the plateform after 2015. The current usage metrics is available 48-96 hours after online publication and is updated daily on week days.
Initial download of the metrics may take a while.