Fig. 2
Download original image
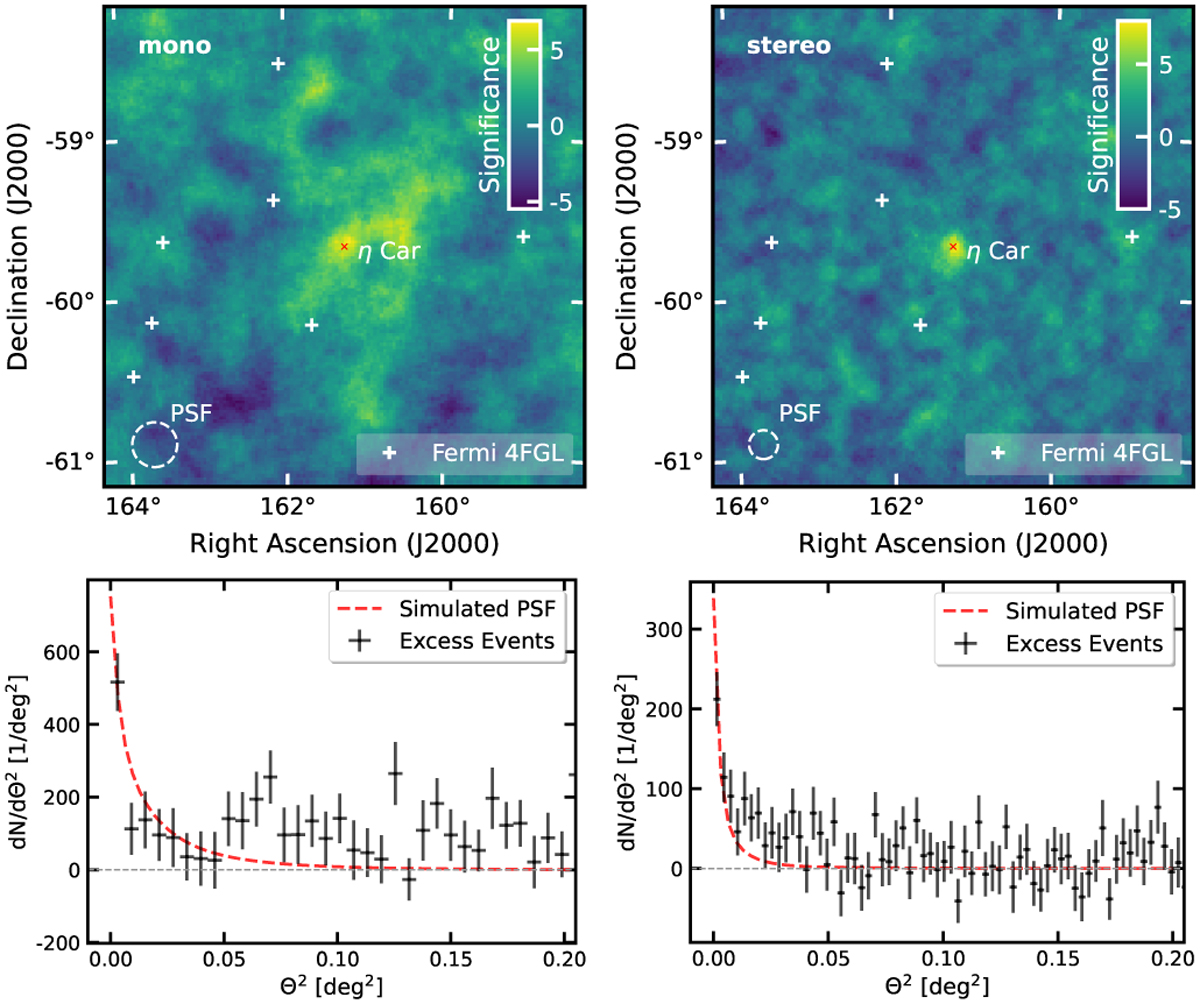
Significance maps and radial excess distributions of the η Car periastron dataset (DS-C). The resulting significance maps for CT5 mono (upper left) and CT1–4 stereo (upper right) are shown with correlation radii of 0.13° and 0.09°, respectively. The position of η Car is marked with a red cross. Additionally, all other Fermi-LAT 4FGL sources (Abdollahi et al. 2022b) in the FoV are marked. The radial excess distributions for mono (lower left) and stereo (lower right) analyses are centred on the η Car position. They are compared to the PSF derived from simulations with an assumed index of 3.3. The scale of the PSF was matched to the first bin.
Current usage metrics show cumulative count of Article Views (full-text article views including HTML views, PDF and ePub downloads, according to the available data) and Abstracts Views on Vision4Press platform.
Data correspond to usage on the plateform after 2015. The current usage metrics is available 48-96 hours after online publication and is updated daily on week days.
Initial download of the metrics may take a while.