Fig. 5
Download original image
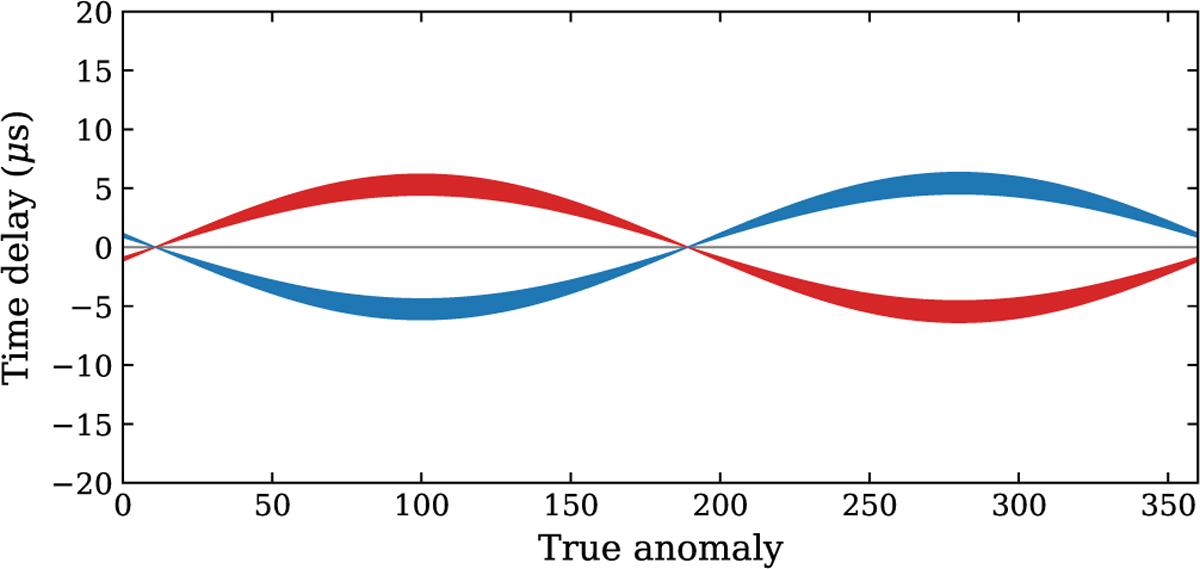
Dispersive time delay within a narrow 2 MHz-band as a comparison to Fig. 3. For all 25 sub-bands, the time difference between the lower edge of the sub-band and the central frequency is shown in red, while the time difference between the upper edge and central frequency is shown in blue. The lower the frequency of the sub-band, the greater the amplitude of the time delay. As one data point is generated per subband for a given sub-integration, this adds a ~10 µs error to the data.
Current usage metrics show cumulative count of Article Views (full-text article views including HTML views, PDF and ePub downloads, according to the available data) and Abstracts Views on Vision4Press platform.
Data correspond to usage on the plateform after 2015. The current usage metrics is available 48-96 hours after online publication and is updated daily on week days.
Initial download of the metrics may take a while.