Fig. 4
Download original image
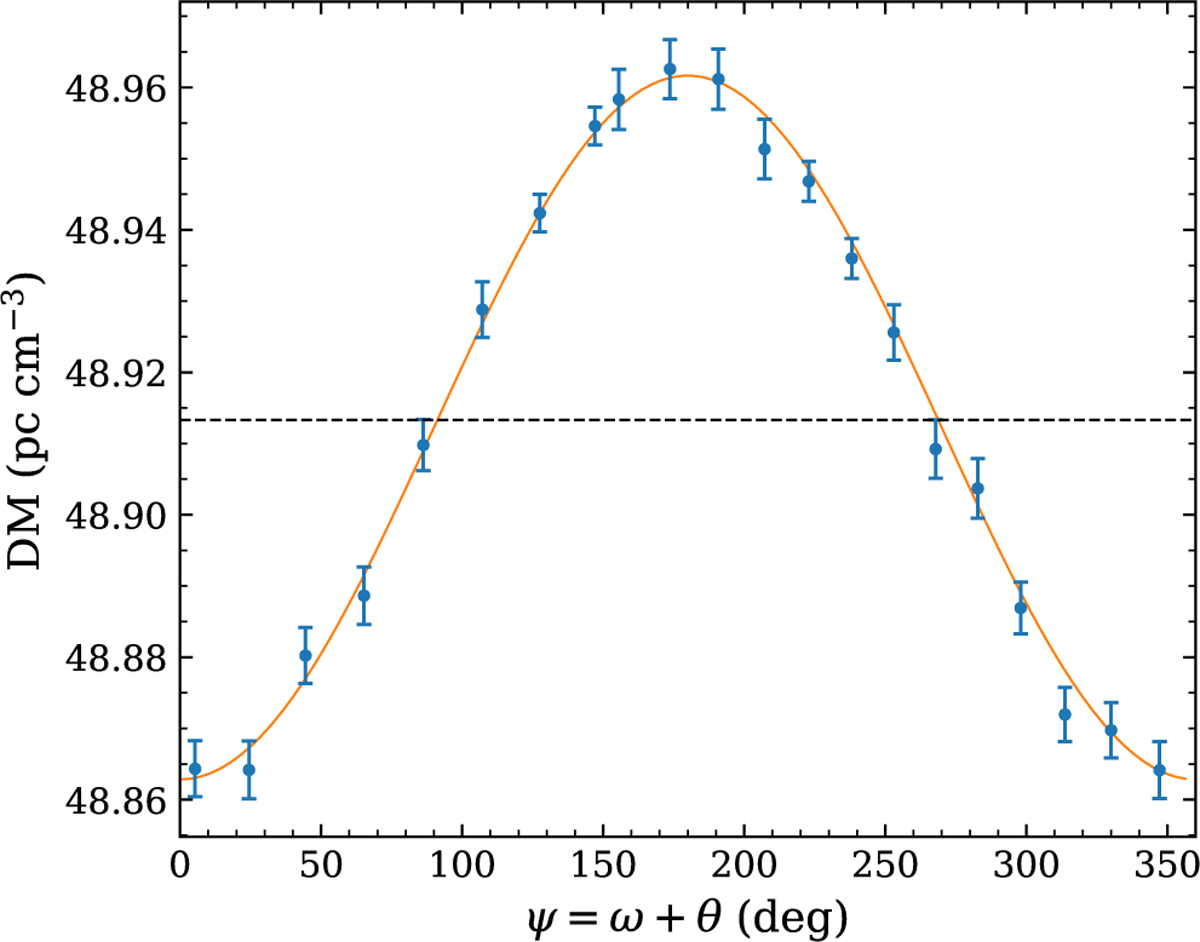
Apparent DM variation reproduced by de-dispersing the simulated data with a non-binary model (shown as blue points), that is, ignoring the dispersive Doppler variation (DDV). The data are plotted against pulsar’s angular orbital position ψ = ω + θ (ω is the longitude of periastron and θ is the relativistic true anomaly) with respect to the ascending node. Both amplitude and phase are consistent with Fig. 2 in Ransom et al. (2004), given that ω ~ 80°. The dashed horizontal line indicates the DM used in the simulation, and the orange line represents the calculation with Eq. (9), which matches perfectly with the simulation.
Current usage metrics show cumulative count of Article Views (full-text article views including HTML views, PDF and ePub downloads, according to the available data) and Abstracts Views on Vision4Press platform.
Data correspond to usage on the plateform after 2015. The current usage metrics is available 48-96 hours after online publication and is updated daily on week days.
Initial download of the metrics may take a while.