Open Access
Fig. 2
Download original image
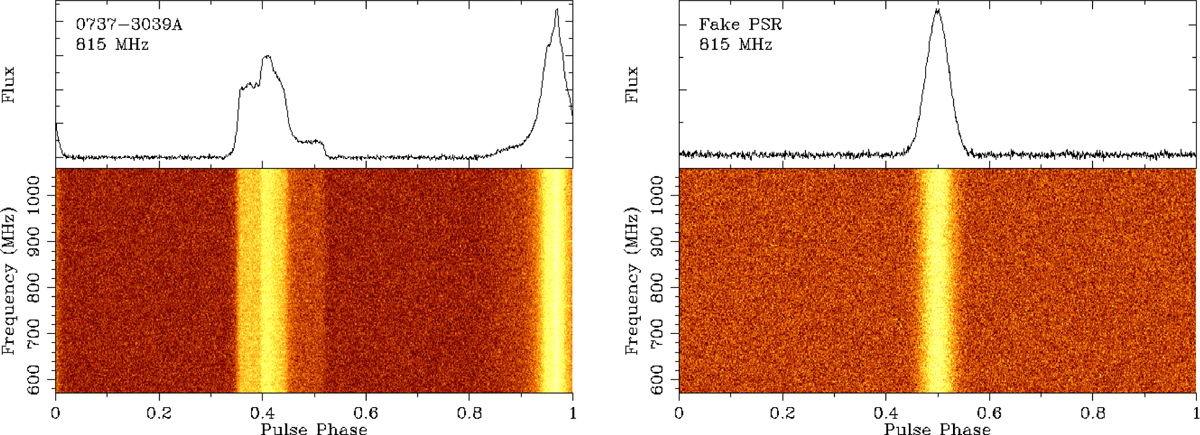
Example of simulated pulsar data files as shown by pazi command of the PSRCHIVE software. The left panel shows the simulated data using the Double Pulsar profile and the right panel shows the simulated data using a broad Gaussian profile.
Current usage metrics show cumulative count of Article Views (full-text article views including HTML views, PDF and ePub downloads, according to the available data) and Abstracts Views on Vision4Press platform.
Data correspond to usage on the plateform after 2015. The current usage metrics is available 48-96 hours after online publication and is updated daily on week days.
Initial download of the metrics may take a while.