Open Access
Fig. 14
Download original image
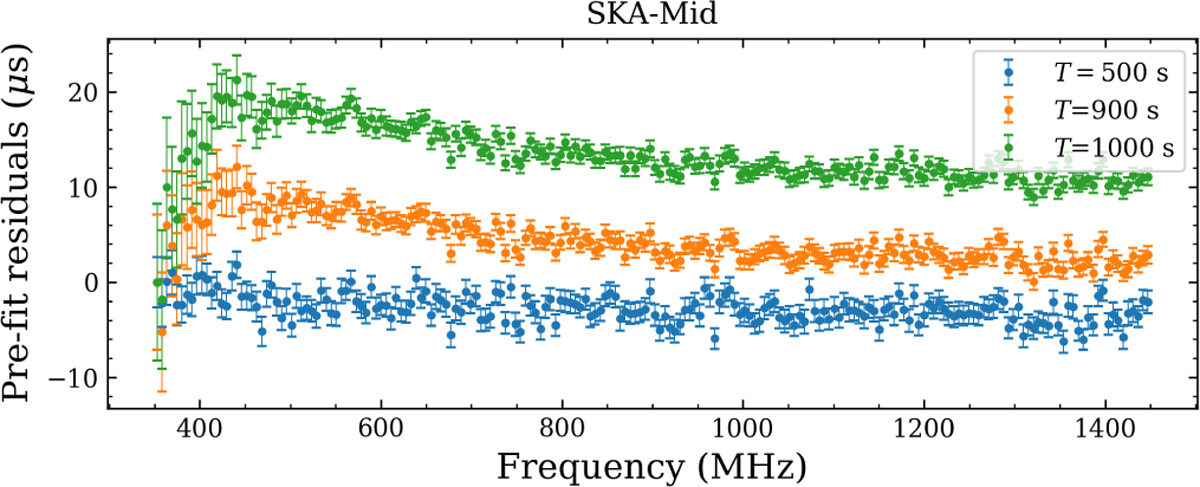
Timing residuals of the TDDS effect simulated for the SKA- Mid data (Setting 2b). The magnitude of the effect gradually increases with the sub-integration time T as predicted by Eq. (14).
Current usage metrics show cumulative count of Article Views (full-text article views including HTML views, PDF and ePub downloads, according to the available data) and Abstracts Views on Vision4Press platform.
Data correspond to usage on the plateform after 2015. The current usage metrics is available 48-96 hours after online publication and is updated daily on week days.
Initial download of the metrics may take a while.