Fig. 12
Download original image
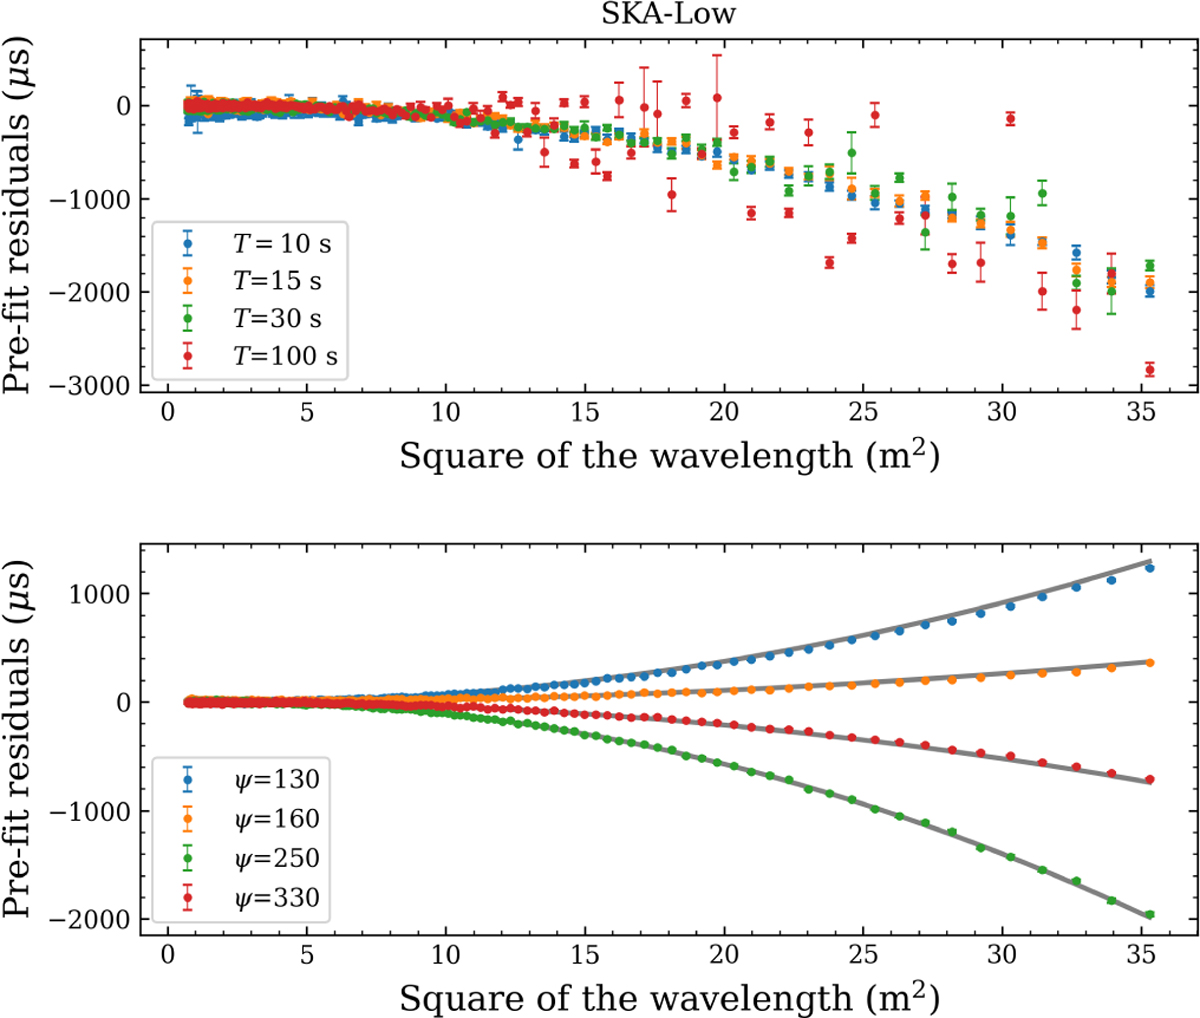
Timing residuals plotted against wavelength squared for simulated SKA-Low data. Upper panel: Timing residuals for a chosen epoch perturbed by SDDS and TDDS different sub-integration times T. For T = 10, 15, 30 s, the effect of SDDS prevails the TDDS and the residuals are consistent; while for T = 100 s, the TDDS dominates and distorts the signal at lower part of the frequency band (see Fig. 13) and increases the residuals. Lower panel: Timing residuals for T = 10 s dominated by the SDDS. The colours correspond to different orbital phases ψ. Grey lines illustrate the theoretical magnitude of the SDDS predicted by Eq. (15).
Current usage metrics show cumulative count of Article Views (full-text article views including HTML views, PDF and ePub downloads, according to the available data) and Abstracts Views on Vision4Press platform.
Data correspond to usage on the plateform after 2015. The current usage metrics is available 48-96 hours after online publication and is updated daily on week days.
Initial download of the metrics may take a while.