Fig. 11
Download original image
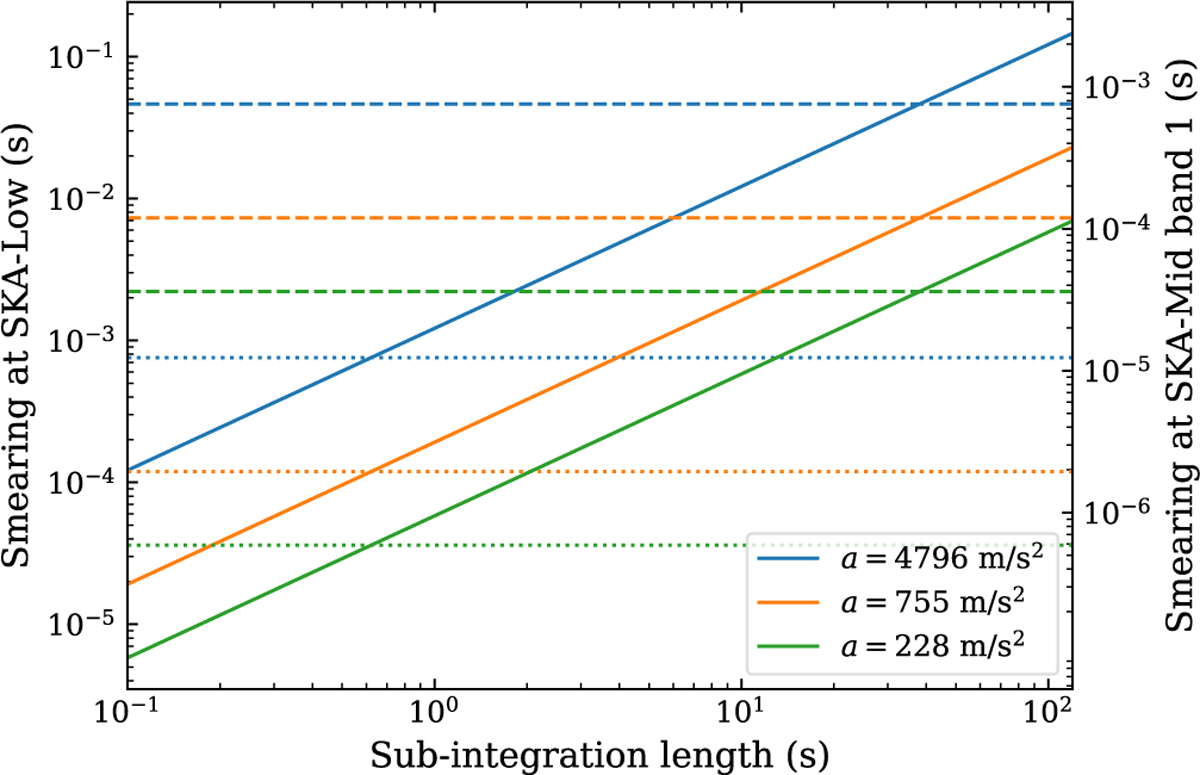
Maximum smearing with respect to sub-integration length for SKA-Low (left y-axis) and SKA-Mid (right y-axis) calculated using Eqs. (14) and (15), assuming the spin period and DM of PSR J0737–3039A, a mass of 1.4 M⊙, and circular orbits. The blue, orange, and green lines denote orbital periods of 15 min, 1 h, and 2.45 h (PSR J0737–3039A), respectively, with the maximum acceleration labelled. The SDDS (dashed lines for SKA-Low and dotted lines for SKA-Mid) dominates over the TDDS (solid lines) when the sub-integration length is smaller than half of the dispersive delay time (∆tDM = 76.1 s for SKA-Low and ∆tDM = 1.2 s for SKA-Mid), and vice versa.
Current usage metrics show cumulative count of Article Views (full-text article views including HTML views, PDF and ePub downloads, according to the available data) and Abstracts Views on Vision4Press platform.
Data correspond to usage on the plateform after 2015. The current usage metrics is available 48-96 hours after online publication and is updated daily on week days.
Initial download of the metrics may take a while.