Fig. 2.
Download original image
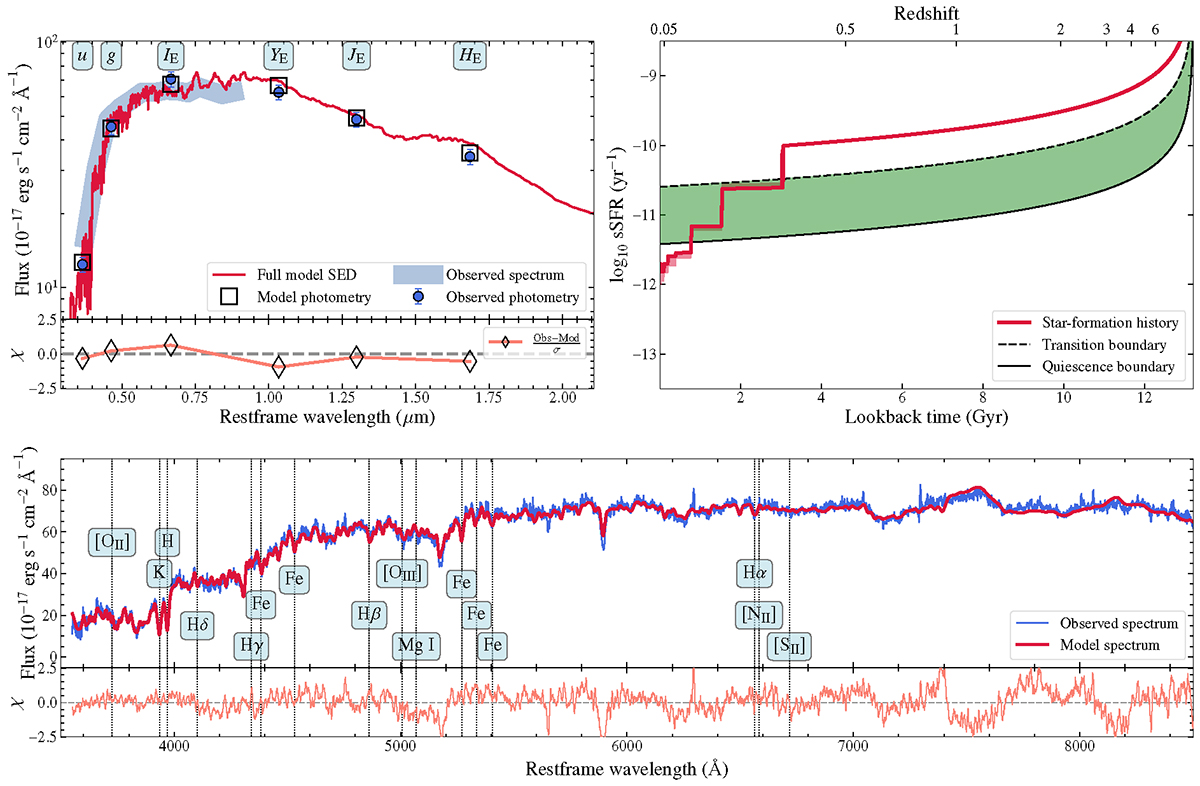
Photometry and spectroscopy for the lensing galaxy. Top left: in the upper panel, blue points indicate the observed photometry from CFHT (MegaCam-u), Subaru (HSC-g), and Euclid (IE, YE, JE, and HE), while open squares indicate the model photometry of the same bands. The red line shows the best-fit model SED, and the grey region marks the spectral region from DESI. The lower panel shows the residuals, defined by (data−model)/σ. Top right: The recovered SFH (red line) and the transition boundary (green shaded area) from star forming (dashed black line) to quiescence (solid black line). Bottom: in the upper panel, the spectroscopic data from DESI, with zd = 0.0424, are shown in blue, while the best-fit model spectrum is shown in red. The vertical dotted lines indicate the central wavelength of various spectral features. The associated lower panel shows the residuals, defined by (data−model)/σ.
Current usage metrics show cumulative count of Article Views (full-text article views including HTML views, PDF and ePub downloads, according to the available data) and Abstracts Views on Vision4Press platform.
Data correspond to usage on the plateform after 2015. The current usage metrics is available 48-96 hours after online publication and is updated daily on week days.
Initial download of the metrics may take a while.