Open Access
Fig. 7
Download original image
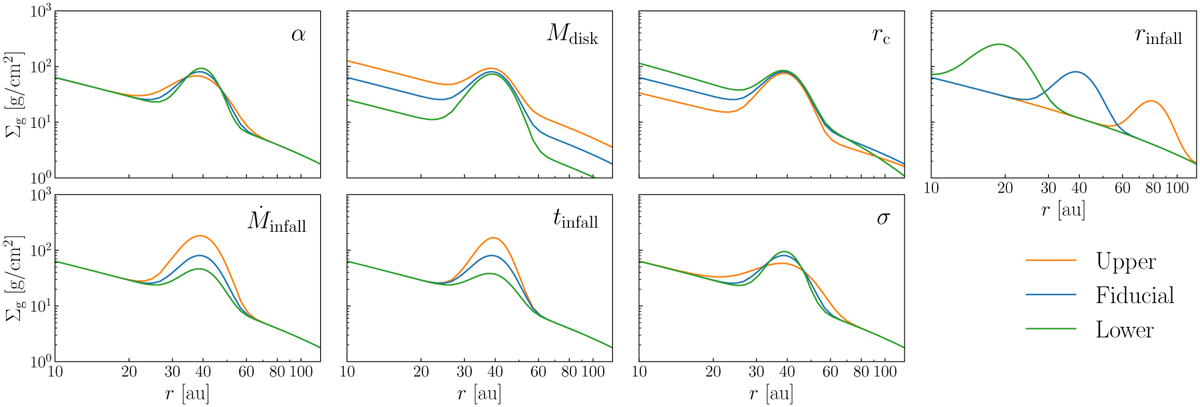
Gas surface density distributions at t = 100 kyr for varying parameters compared with the fiducial setup. Each panel is labeled with the varied parameter, with green and orange curves representing decreased and increased parameter values in Table 1, respectively.
Current usage metrics show cumulative count of Article Views (full-text article views including HTML views, PDF and ePub downloads, according to the available data) and Abstracts Views on Vision4Press platform.
Data correspond to usage on the plateform after 2015. The current usage metrics is available 48-96 hours after online publication and is updated daily on week days.
Initial download of the metrics may take a while.