Fig. 11
Download original image
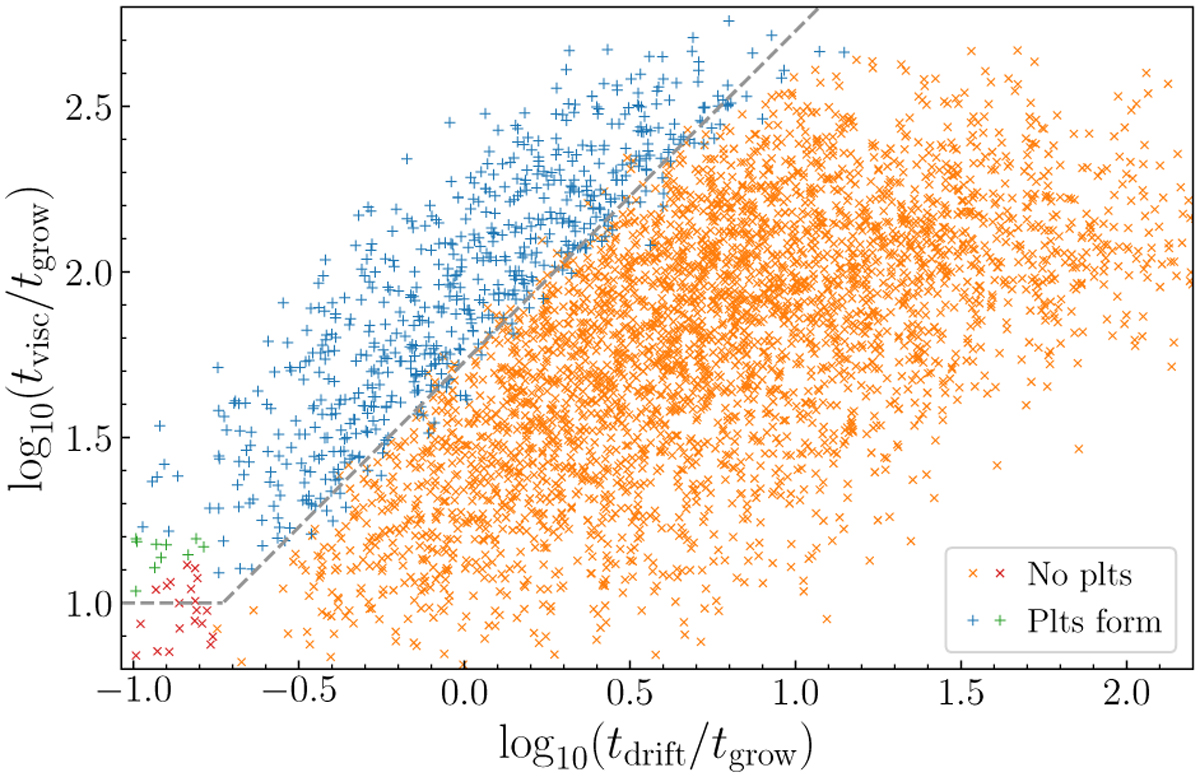
Distribution of timescale ratios tdrift/tgrow and tvisc /tgrow. The plus symbols (“+”) represent simulations in which planetesimals form, while the cross symbols (“x”) indicate simulations with no planetesimal formation. Blue and orange markers show the Sobol-sampled simulations, while red and green markers represent a subset of 30 selected simulations from these Sobol-sampled simulations, with a reduced initial global dust-to-gas ratio (ϵinit = 10−2.25). The dashed gray line denotes the fitted boundary of the planetesimal-forming domain.
Current usage metrics show cumulative count of Article Views (full-text article views including HTML views, PDF and ePub downloads, according to the available data) and Abstracts Views on Vision4Press platform.
Data correspond to usage on the plateform after 2015. The current usage metrics is available 48-96 hours after online publication and is updated daily on week days.
Initial download of the metrics may take a while.