Fig. 10
Download original image
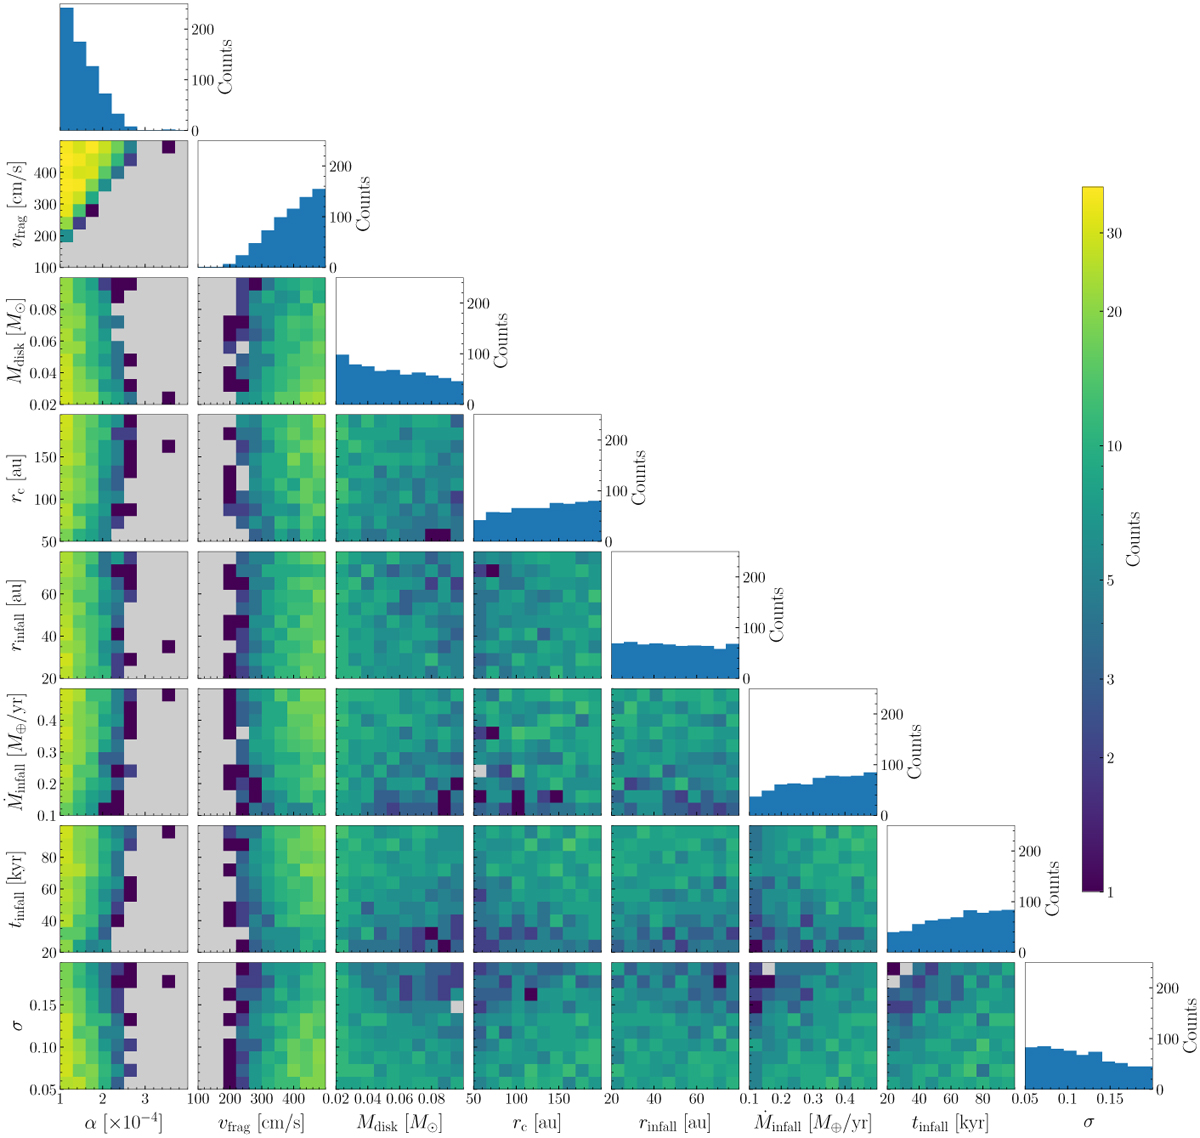
Histograms of 653 simulations where planetesimal formation occurs, out of 4096 Sobol-sampled simulations. “Counts” refers to the number of simulations. The 1D histograms along the diagonal show the distribution over each of the eight parameters individually. The 2D heatmap histograms display the joint distributions over pairs of parameters, with gray cells indicating a count of 0.
Current usage metrics show cumulative count of Article Views (full-text article views including HTML views, PDF and ePub downloads, according to the available data) and Abstracts Views on Vision4Press platform.
Data correspond to usage on the plateform after 2015. The current usage metrics is available 48-96 hours after online publication and is updated daily on week days.
Initial download of the metrics may take a while.