Fig. A.1.
Download original image
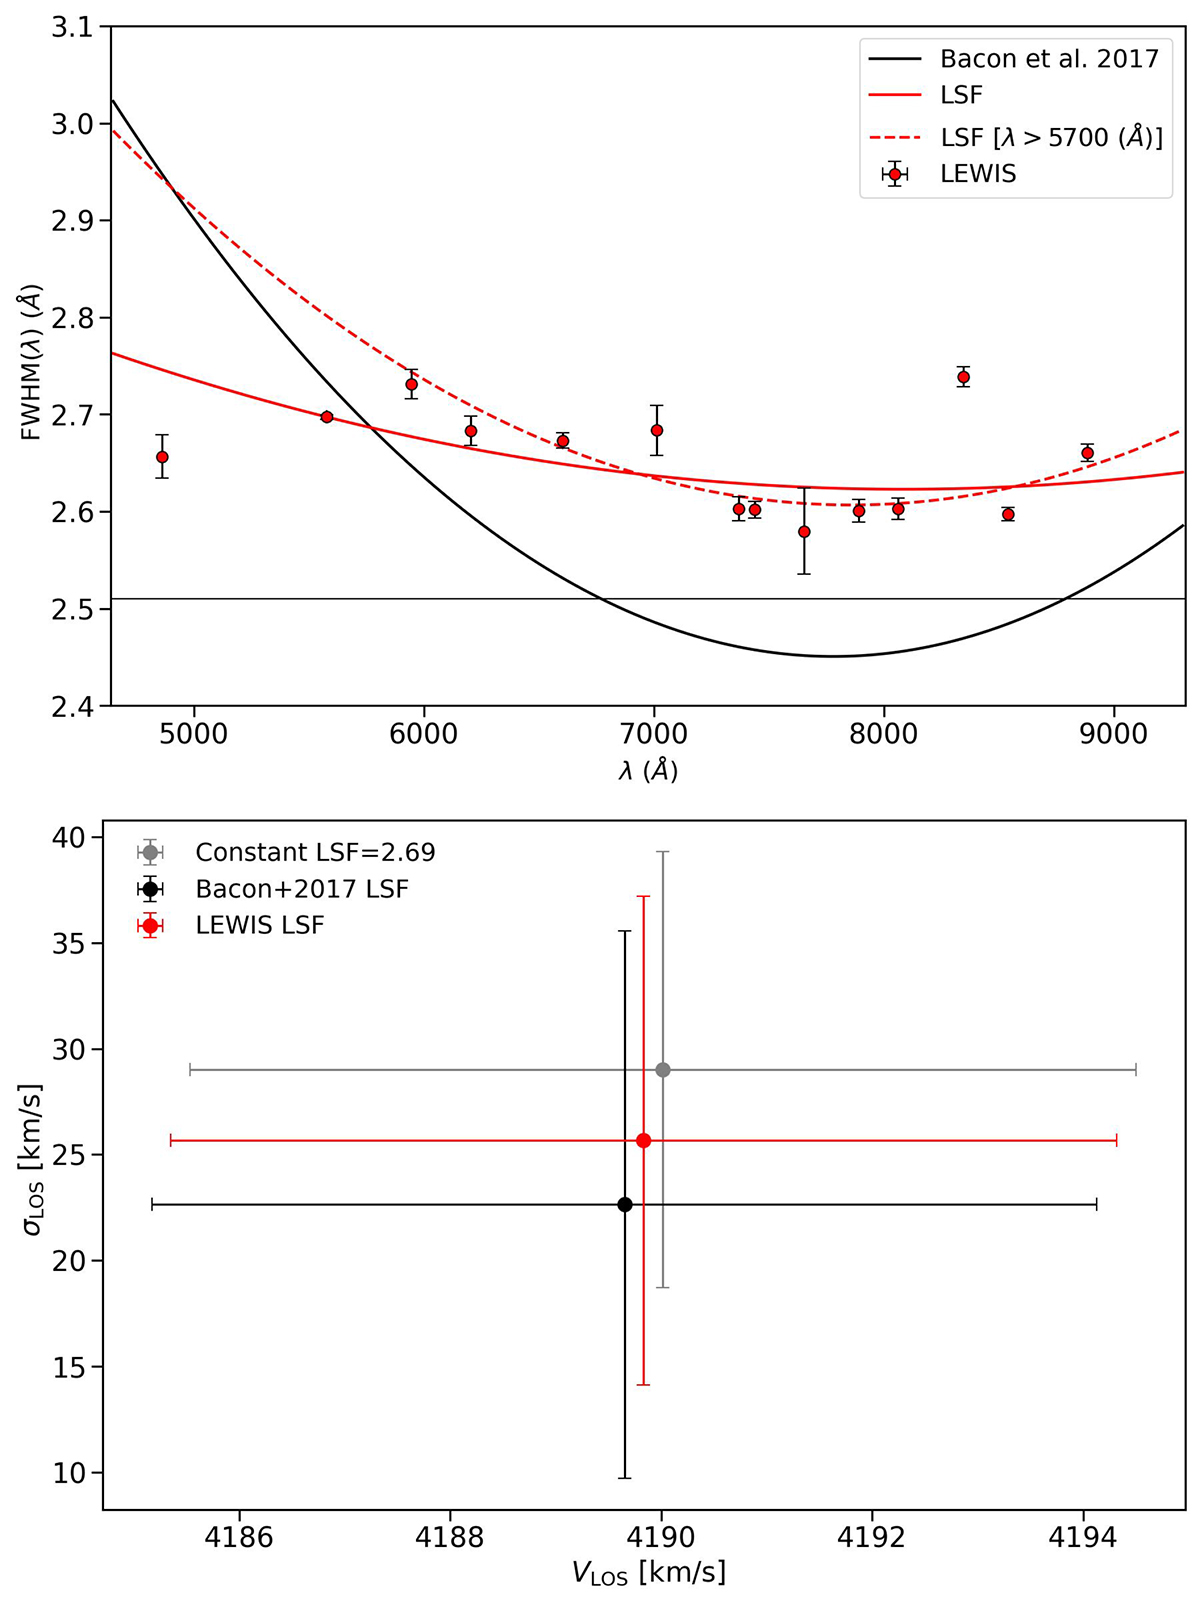
Top panel: MUSE LSF from Bacon et al. (2017) (thick black line) and in LEWIS data (thick red line, Eq. A.1). The red dashed line represents the MUSE LSF derived restricting the polynomial fit to λ > 5700 Å (Eq. A.2). The thin horizontal black line marks the spectral resolution of the E-MILES stellar library (FWHM = 2.51Å). Bottom panel: comparison of PPXF results for Bacon et al. (2017) LSF (black), LEWIS LSF (red, Eq. A.2) and constant LSF (grey, FWHM[4800-7000] = 2.69Å).
Current usage metrics show cumulative count of Article Views (full-text article views including HTML views, PDF and ePub downloads, according to the available data) and Abstracts Views on Vision4Press platform.
Data correspond to usage on the plateform after 2015. The current usage metrics is available 48-96 hours after online publication and is updated daily on week days.
Initial download of the metrics may take a while.