Fig. 7.
Download original image
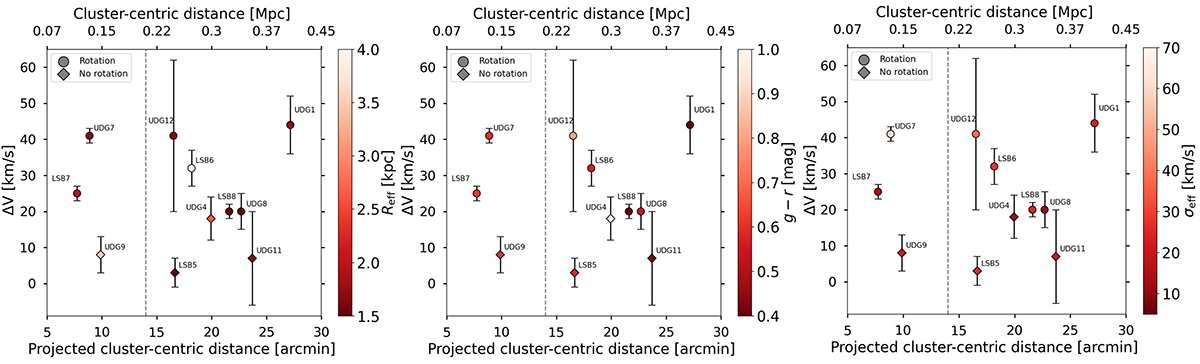
Correlations between kinematic properties and cluster environment. Semi-amplitude of the rotation curve ΔV as a function of the cluster-centric distance. The data points are colour-coded according to the values of the Reff (left panel), colour g − r (central panel), and σeff (right panel). As in Figure 6, the vertical dashed line marks the extension of the X-ray emission. The circles represent galaxies that rotate along the photometric major axis or intermediate axis (R and IR-type), and triangles show galaxies without rotation (NR-type).
Current usage metrics show cumulative count of Article Views (full-text article views including HTML views, PDF and ePub downloads, according to the available data) and Abstracts Views on Vision4Press platform.
Data correspond to usage on the plateform after 2015. The current usage metrics is available 48-96 hours after online publication and is updated daily on week days.
Initial download of the metrics may take a while.