Fig. 6.
Download original image
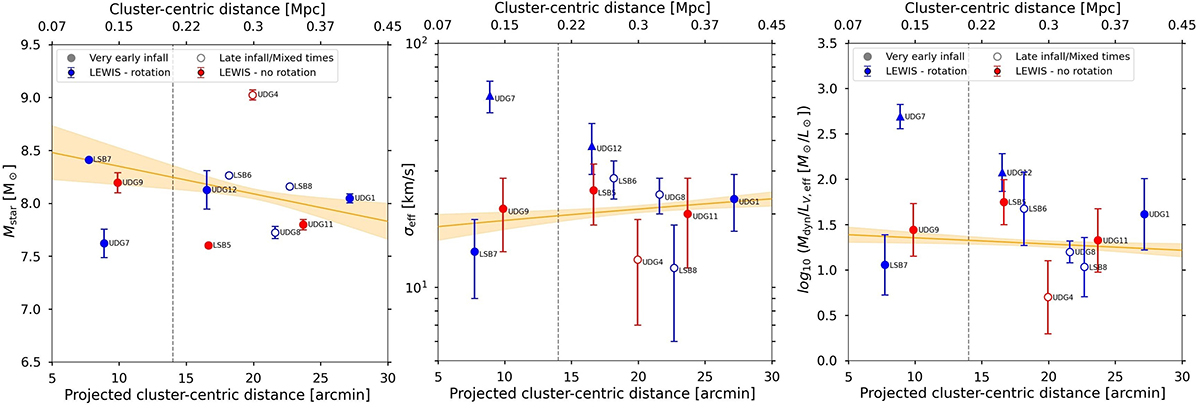
Correlations between structural properties and cluster environment. Left panel: Stellar mass as a function of the cluster-centric distance. Middle panel: σeff as a function of the cluster-centric distance. Right panel: Dynamical mass-to-light ratio Mdyn/LV, eff as a function of the cluster-centric distance. The vertical dashed grey line marks the radial distance within which the X-ray emission of the cD galaxy dominates (14 arcmin, Spavone et al. 2024). The labels identify the LEWIS galaxies. Filled circles represent galaxies classified as very early infall, and empty circles represent galaxies classified as late infall or mixed times. The blue and red circles represent rotating and non-rotating galaxies, respectively. The yellow line represents a linear fit obtained by excluding the values for UDG7 and UDG12. The uncertainties on the fitting lines were computed using a bootstrap technique. In the central and right panels, UDG7 and UDG12 are marked with triangles since their values of σeff and Mdyn/LV, eff might be overestimated due to their non-negligible rotation.
Current usage metrics show cumulative count of Article Views (full-text article views including HTML views, PDF and ePub downloads, according to the available data) and Abstracts Views on Vision4Press platform.
Data correspond to usage on the plateform after 2015. The current usage metrics is available 48-96 hours after online publication and is updated daily on week days.
Initial download of the metrics may take a while.