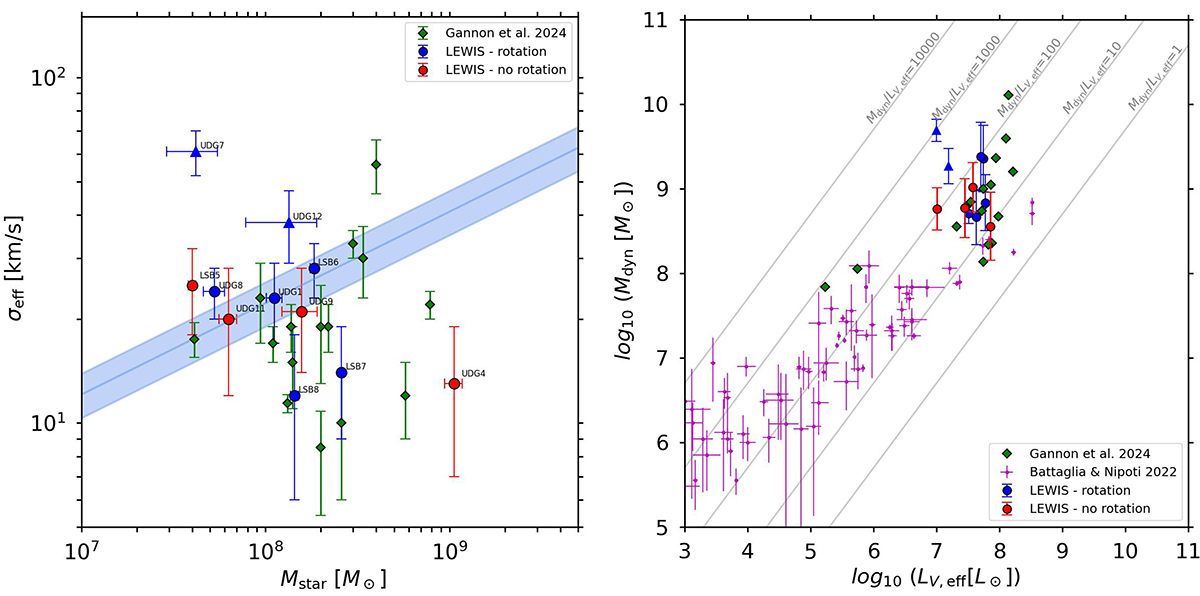
Fig. 4.
Download original image
Faber-Jackson relation and dark matter content in LEWIS sample. Left panel: Velocity dispersion σeff as a function of stellar masses of UDGs from the literature (green diamonds) and the LEWIS sample. The blue and red circles represent rotating and non-rotating LEWIS galaxies, respectively. The shaded light blue region represents the luminosity Faber-Jackson relation, extrapolated to the low-mass regime (L ∼ σ2.2, Kourkchi et al. 2012). The luminosities are converted into stellar masses using the Into & Portinari (2013) colour – M/L relation. UDG7 and UDG12 are marked with triangles since their values of σeff might be overestimated due to their non-negligible rotation. Right panel: Dynamical mass (Mdyn) as a function of the V-band total luminosity (LV, eff) computed within 1Reff of UDGs from the literature (green diamonds) and the LEWIS sample. The points are colour-coded as in the left panel. The solid grey lines mark the loci in the plane where Mdyn/LV, eff is constant and equal to 1, 10, 100, 1000, and 10 000, respectively. The magenta points represent the dwarf galaxies in the Local Group analysed by Battaglia & Nipoti (2022).
Current usage metrics show cumulative count of Article Views (full-text article views including HTML views, PDF and ePub downloads, according to the available data) and Abstracts Views on Vision4Press platform.
Data correspond to usage on the plateform after 2015. The current usage metrics is available 48-96 hours after online publication and is updated daily on week days.
Initial download of the metrics may take a while.