Fig. 3.
Download original image
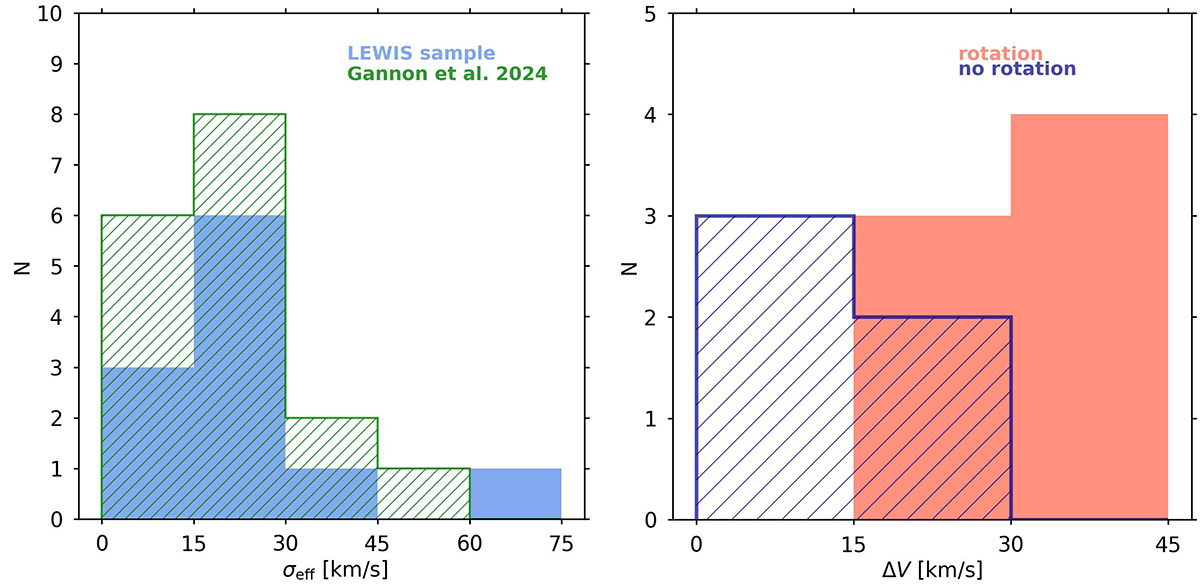
Distributions of velocity dispersions and rotation curve semi-amplitudes of LEWIS sample. Left panel: Distributions of σeff of UDGs from literature (green histogram) and the LEWIS sample. The light blue histogram corresponds to the distribution of galaxies with a constrained fit (C-fit type). Right panel: Distribution of ΔV of UDGs in the LEWIS sample. The pink and blue histograms correspond to UDGs with a mild rotation along any axis (R and IR type) and those without rotation (NR type), respectively.
Current usage metrics show cumulative count of Article Views (full-text article views including HTML views, PDF and ePub downloads, according to the available data) and Abstracts Views on Vision4Press platform.
Data correspond to usage on the plateform after 2015. The current usage metrics is available 48-96 hours after online publication and is updated daily on week days.
Initial download of the metrics may take a while.