Fig. 2.
Download original image
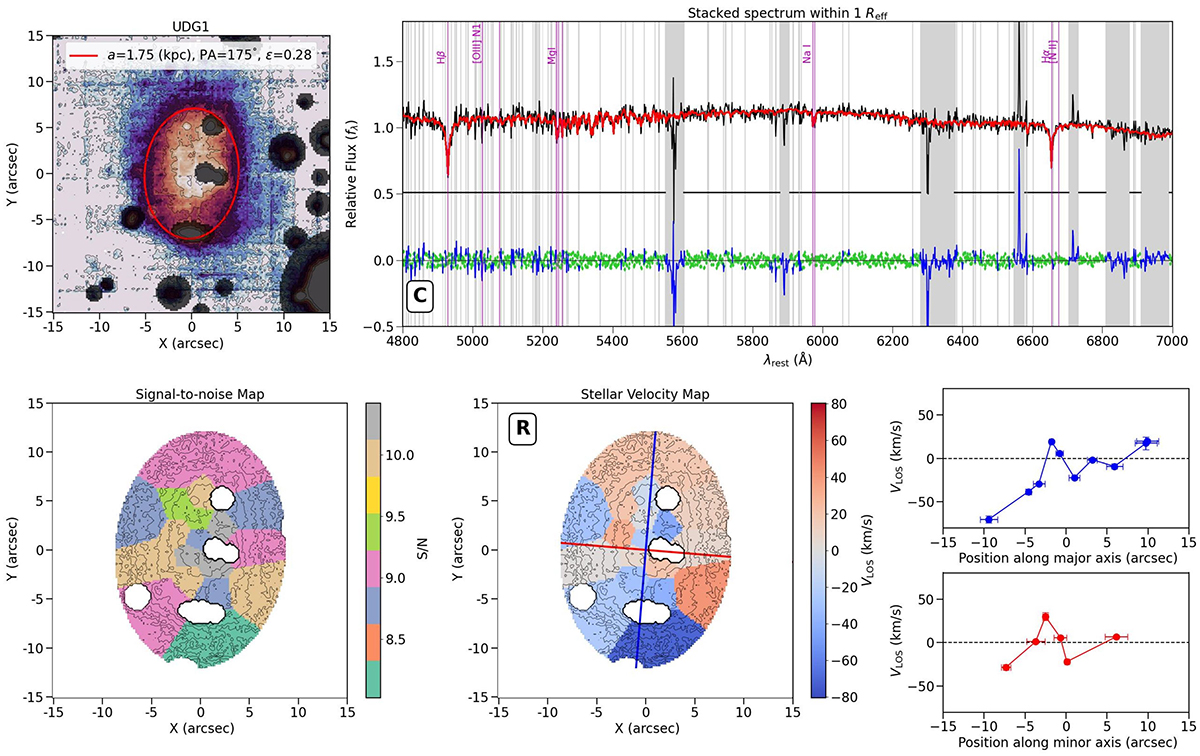
Stacked (1D) and spatially resolved (2D) stellar kinematics of UDG1. Top left panel: MUSE-reconstructed image of UDG1. The red ellipse represents the elliptical region we used to extract the stacked spectrum within 1Reff, and the grey circles show the masked image regions. The top label reports the values of the semi-major axis (a), position angle (PA), and ellipticity (ϵ) of the ellipse. Top right panel: MUSE 1Reff stacked spectrum (solid black line) for UDG1. The bottom label reports the fit type (Table 2). The main absorption features are marked with magenta lines and labels. The solid red line represents the best-fitting spectrum obtained with PPXF. The green points show the residuals between the observed and its best-fitting spectrum. The grey areas show the masked spectral regions that we excluded from the fit. The residual points excluded from the fit are marked in blue. Bottom left panel: Voronoi-binned map of the S/N. Bottom middle panel: Stellar velocity map subtracted from the systemic velocity Vsys. The top label reports the type of rotation (Table 2). The blue and red lines mark the photometric major and minor axes of the galaxy, respectively. Bottom right panel: Velocity profiles extracted along the major (top) and minor (bottom) axes and subtracted from Vsys.
Current usage metrics show cumulative count of Article Views (full-text article views including HTML views, PDF and ePub downloads, according to the available data) and Abstracts Views on Vision4Press platform.
Data correspond to usage on the plateform after 2015. The current usage metrics is available 48-96 hours after online publication and is updated daily on week days.
Initial download of the metrics may take a while.