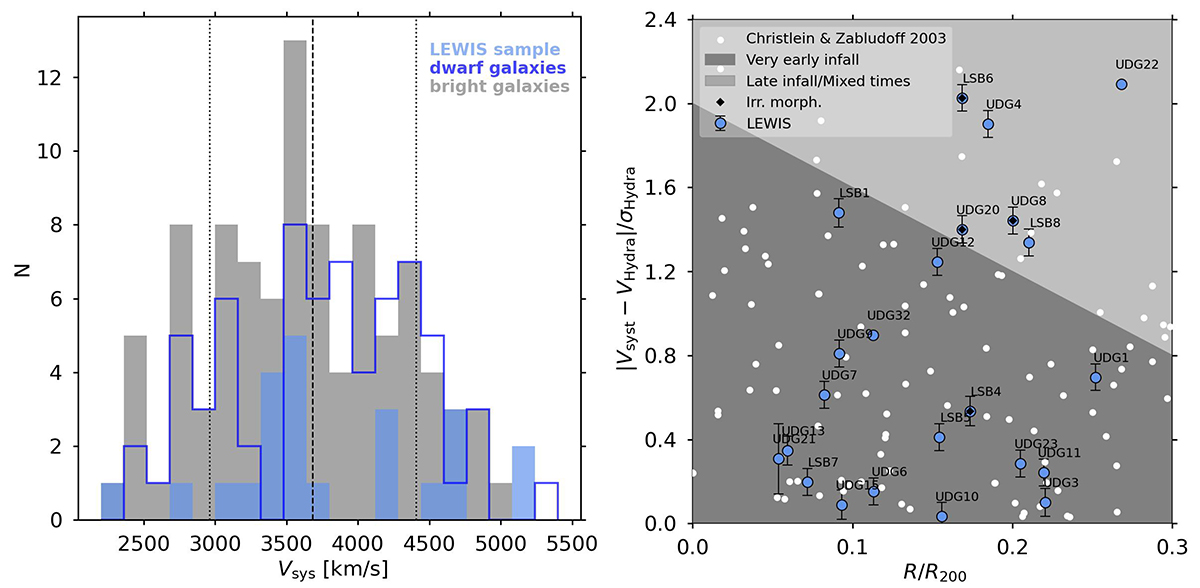
Fig. 1.
Download original image
Velocity and phase-space distributions of galaxies in Hydra I. Left panel: Distributions of the systemic velocity for galaxies in the LEWIS sample (light blue histogram), bright galaxies (mB < 16 mag, grey histogram) and dwarf galaxies (blue histogram) in Hydra I. The vertical dashed line represents the average cluster velocity (VHydra = 3683 ± 46 km s−1, from Christlein & Zabludoff 2003), and the vertical dotted lines mark the cluster velocity dispersion (σHydra = 724 ± 31 km s−1, from Lima-Dias et al. 2021). Right panel: Phase-space diagnostic diagram for galaxies in Hydra I. The systemic galaxy velocity relative to the average velocity of the cluster normalised by the cluster velocity dispersion (|Vsyst − VHydra|/σHydra) is shown as a function of the projected clustercentric distance normalised by the virial radius of the cluster (R/R200). Galaxies from the LEWIS sample are marked with light blue circles, and galaxies from Christlein & Zabludoff (2003) are marked with white dots. The black diamonds mark the objects with an irregular morphology (UDG8, UDG20, LSB4, and LSB6) described in Section 3. The shaded regions represent the very early (dark grey) and late infall or mixed times (light grey) regions (Rhee et al. 2017; Forbes et al. 2023).
Current usage metrics show cumulative count of Article Views (full-text article views including HTML views, PDF and ePub downloads, according to the available data) and Abstracts Views on Vision4Press platform.
Data correspond to usage on the plateform after 2015. The current usage metrics is available 48-96 hours after online publication and is updated daily on week days.
Initial download of the metrics may take a while.