Fig. 8.
Download original image
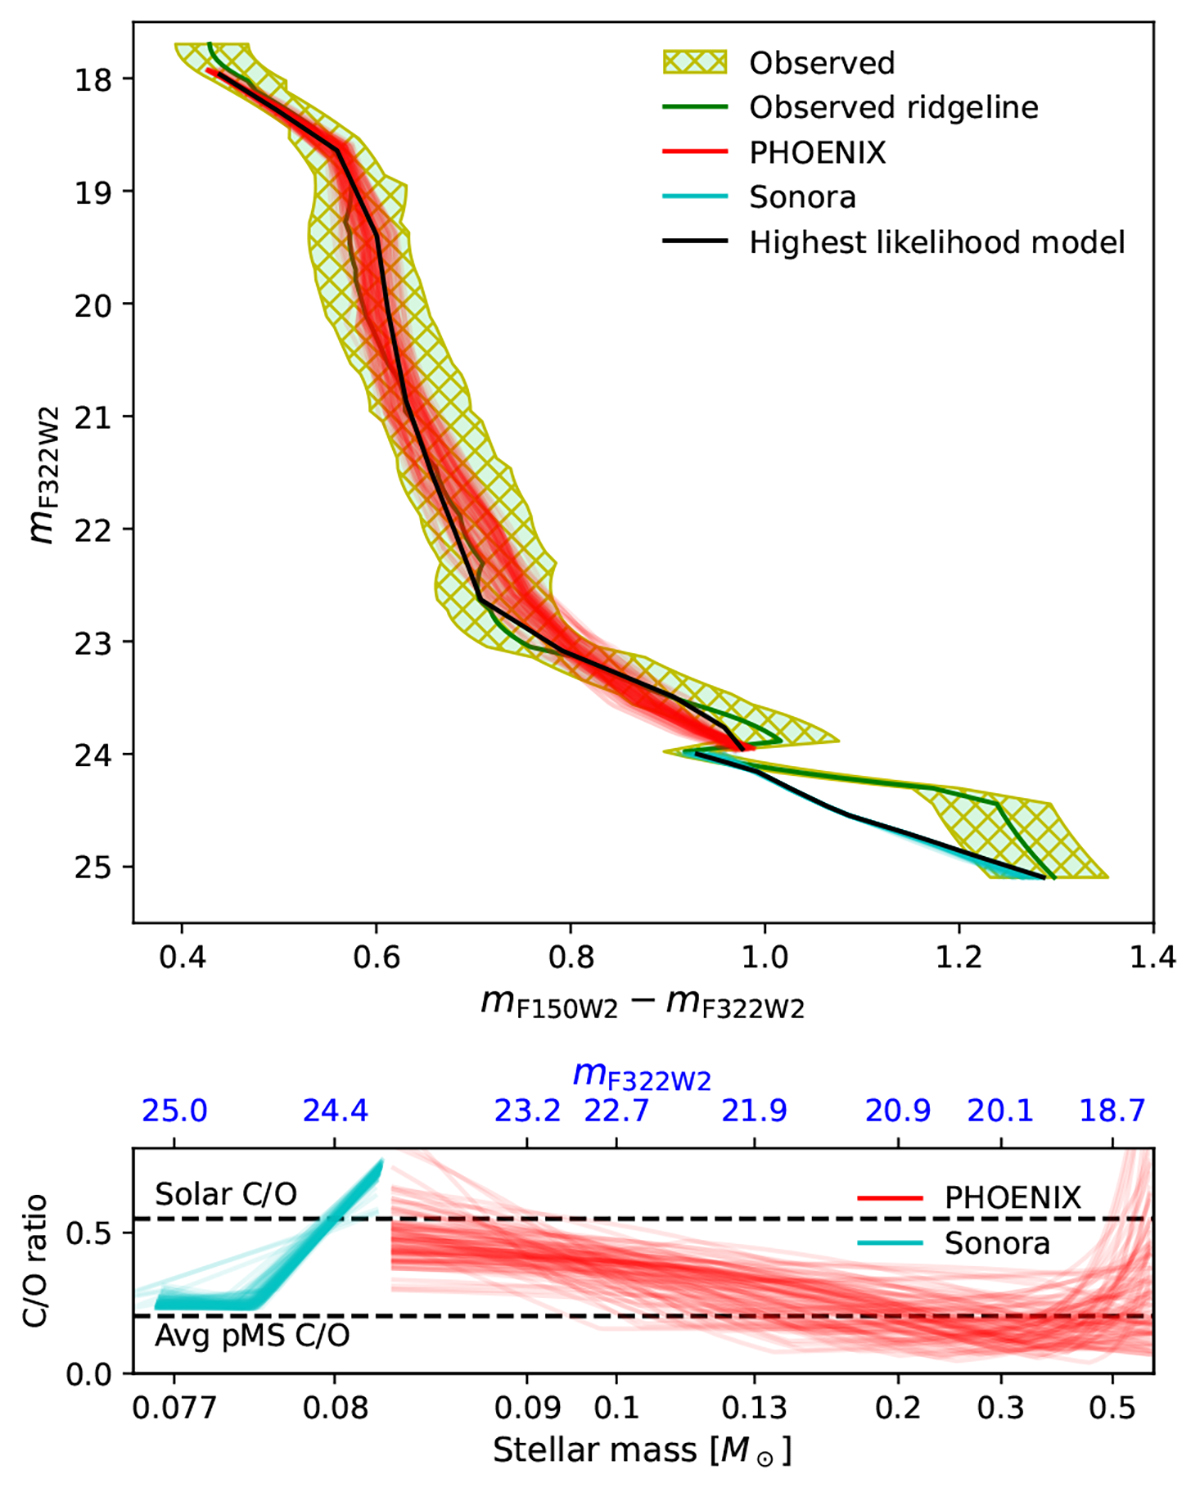
Comparison of CMD fits and C/O abundance ratios as a function of stellar mass. Top: CMD fits of the observed colour distribution in 47 Tuc to models with abundances that vary with stellar mass. The red and cyan lines show the model CMDs from 100 randomly chosen MCMC steps for PHOENIX and Sonora model atmospheres, respectively. In both cases, the step with the highest likelihood is shown in black. Bottom: the C/O abundance ratio as a function of stellar mass for the same MCMC steps as in the top panel. The scaling of the mass axis is logarithmic in (M − 0.075 M⊙). The corresponding magnitudes are indicated in blue. The solar C/O ratio of 0.55 and the average spectroscopically inferred 47 Tuc C/O from post-MS (pMS) members of 0.20 are shown with horizontal dashed lines, based on Caffau et al. (2011) and Cordero et al. (2014), Thygesen et al. (2014), Marino et al. (2016), respectively. The large values of C/O predicted by PHOENIX models at M ≳ 0.5 M⊙ are likely an artefact of the method, since our models only incorporate the effect of atmospheric chemistry that is expected to be sub-dominant at those high masses.
Current usage metrics show cumulative count of Article Views (full-text article views including HTML views, PDF and ePub downloads, according to the available data) and Abstracts Views on Vision4Press platform.
Data correspond to usage on the plateform after 2015. The current usage metrics is available 48-96 hours after online publication and is updated daily on week days.
Initial download of the metrics may take a while.