Fig. 7.
Download original image
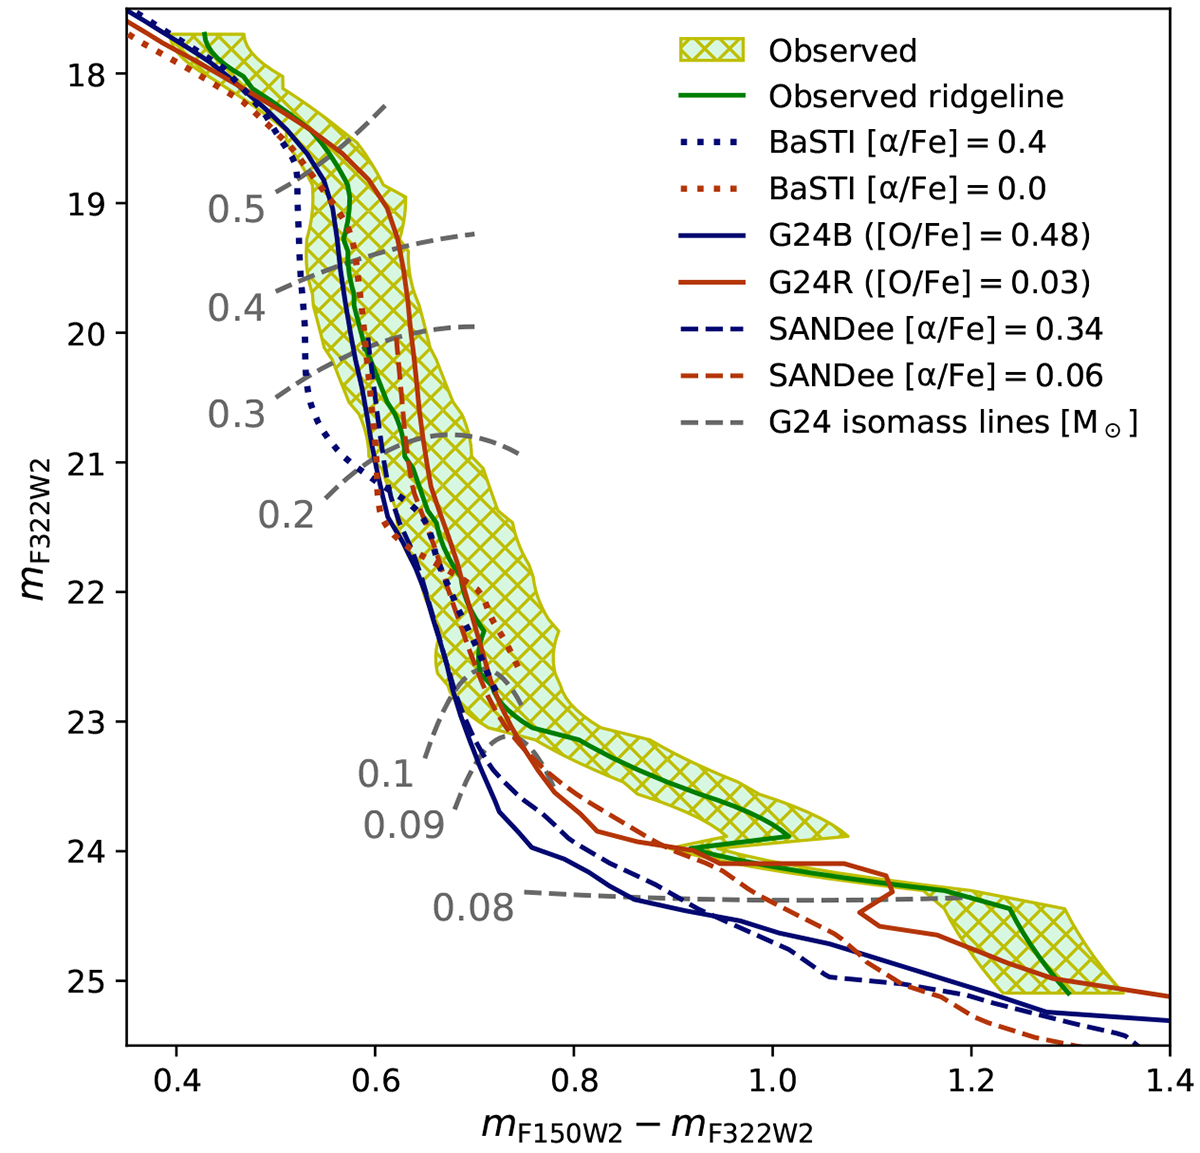
Comparison of the observed colour distribution in 47 Tuc with theoretical isochrones from three different sets of models. For each set, two isochrones are shown with distinct [O/Fe] to represent the mPOPs distribution of oxygen abundances in the cluster. The shaded area spans the 5th and the 95th percentiles of the colour spread at each magnitude with the median percentile (the ridgeline) shown in green. G24 refers to Gerasimov et al. (2024b).
Current usage metrics show cumulative count of Article Views (full-text article views including HTML views, PDF and ePub downloads, according to the available data) and Abstracts Views on Vision4Press platform.
Data correspond to usage on the plateform after 2015. The current usage metrics is available 48-96 hours after online publication and is updated daily on week days.
Initial download of the metrics may take a while.