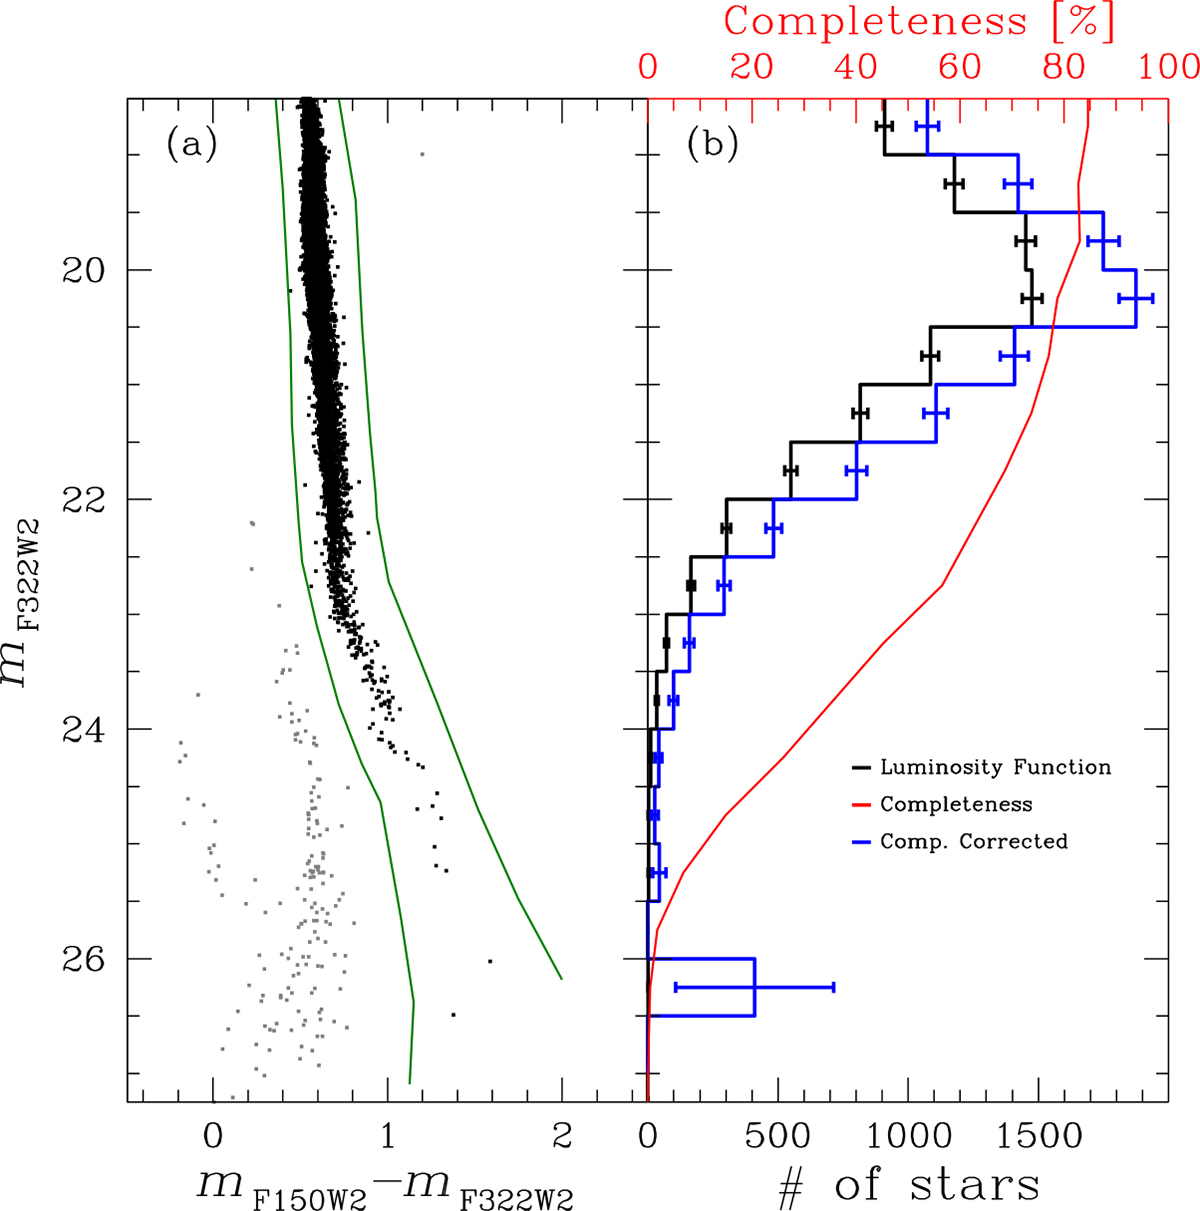
Fig. 10.
Download original image
Luminosity function of 47 Tuc. (a) mF322W2 versus mF150W2 − mF322W2 CMD for our selected sample of stars. The two green lines are used to isolate the 47 Tuc MS stars. Sources between the two green lines are represented in black, while other stars are represented in grey. (b) Number counts of stars (in black), binned into 0.5 mF322W2 magnitude intervals, corresponding to the black points in (a). The red line shows the completeness as a function of magnitude, with values reported at the top of the plot. The completeness-corrected LF is represented in blue.
Current usage metrics show cumulative count of Article Views (full-text article views including HTML views, PDF and ePub downloads, according to the available data) and Abstracts Views on Vision4Press platform.
Data correspond to usage on the plateform after 2015. The current usage metrics is available 48-96 hours after online publication and is updated daily on week days.
Initial download of the metrics may take a while.