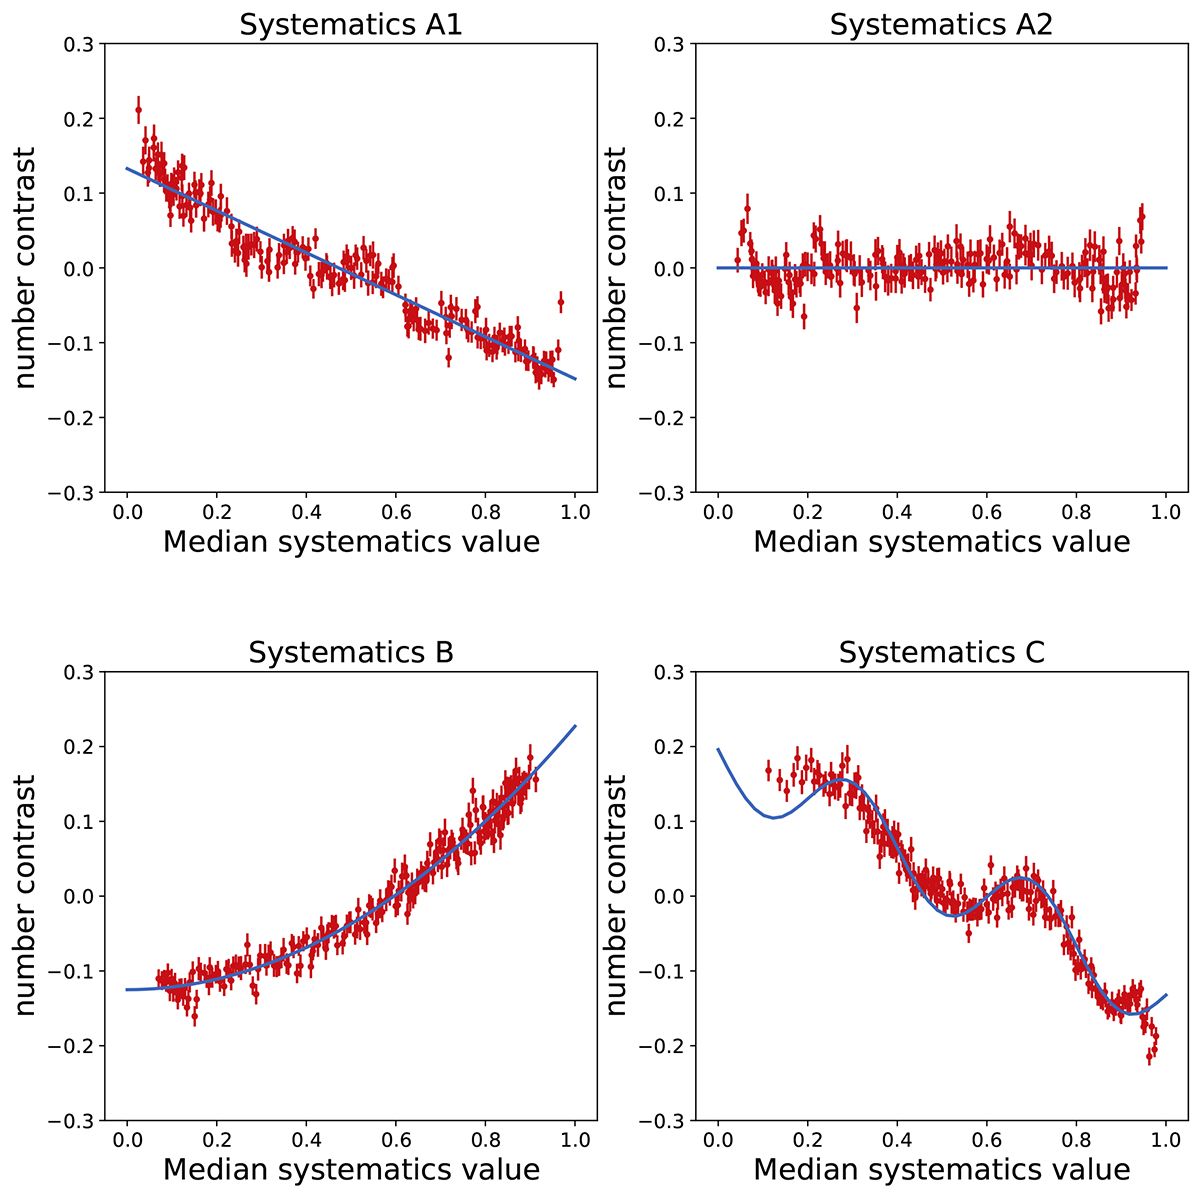
Fig. 9.

Download original image
Relationship between the galaxy number contrast and the mean systematic value of each hierarchical cluster. The blue curves are the number contrast derived from the input selection rates (black curves in the colour bars of Fig. 7). The average median systematics and number contrast are calculated by averaging the sorted values in each realisation across all the realisations. The standard errors are also calculated and presented as error bars. The errors of the median systematics are too small to be visible.
Current usage metrics show cumulative count of Article Views (full-text article views including HTML views, PDF and ePub downloads, according to the available data) and Abstracts Views on Vision4Press platform.
Data correspond to usage on the plateform after 2015. The current usage metrics is available 48-96 hours after online publication and is updated daily on week days.
Initial download of the metrics may take a while.


