Fig. 7.
Download original image
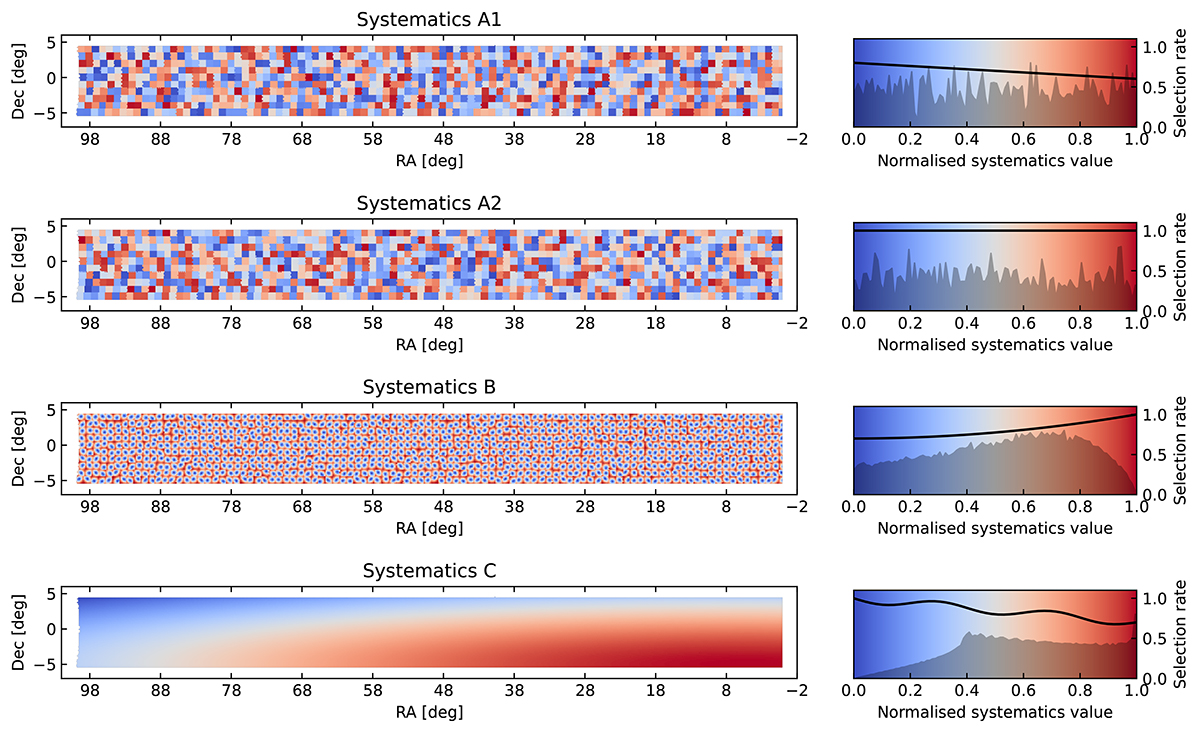
Left panels: Spatial distribution of the four toy systematics. Systematics A1 and A2 are uniform in each tile, but differ across tiles (type A); Systematics B varies within each tile (type B); Systematics C is tile-independent (type C); Right panels: Black curves in the colour bar show the selection function of each systematic and the shaded region is the normalised distribution of the systematics. The numbers on the right show the selection rate values.
Current usage metrics show cumulative count of Article Views (full-text article views including HTML views, PDF and ePub downloads, according to the available data) and Abstracts Views on Vision4Press platform.
Data correspond to usage on the plateform after 2015. The current usage metrics is available 48-96 hours after online publication and is updated daily on week days.
Initial download of the metrics may take a while.