Fig. 5.
Download original image
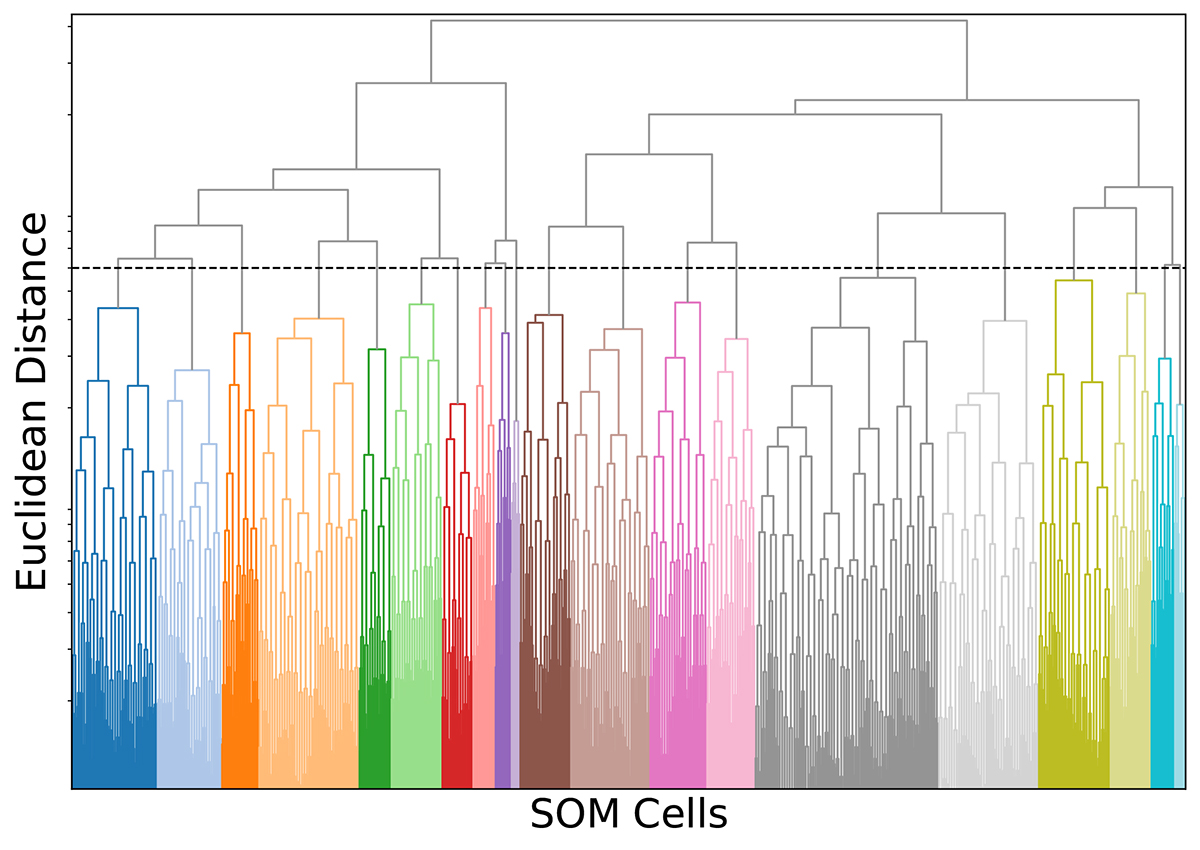
Example of a dendrogram showing the clustering of 900 SOM cells into 20 HCs. The cells are clustered from the bottom to the top according to their Euclidean distance in the systematics space. The black dashed line shows the distance threshold where the cells are grouped into 20 clusters. SOM cells resulting in the same clusters are colour-coded with the same colour.
Current usage metrics show cumulative count of Article Views (full-text article views including HTML views, PDF and ePub downloads, according to the available data) and Abstracts Views on Vision4Press platform.
Data correspond to usage on the plateform after 2015. The current usage metrics is available 48-96 hours after online publication and is updated daily on week days.
Initial download of the metrics may take a while.