Fig. 4.
Download original image
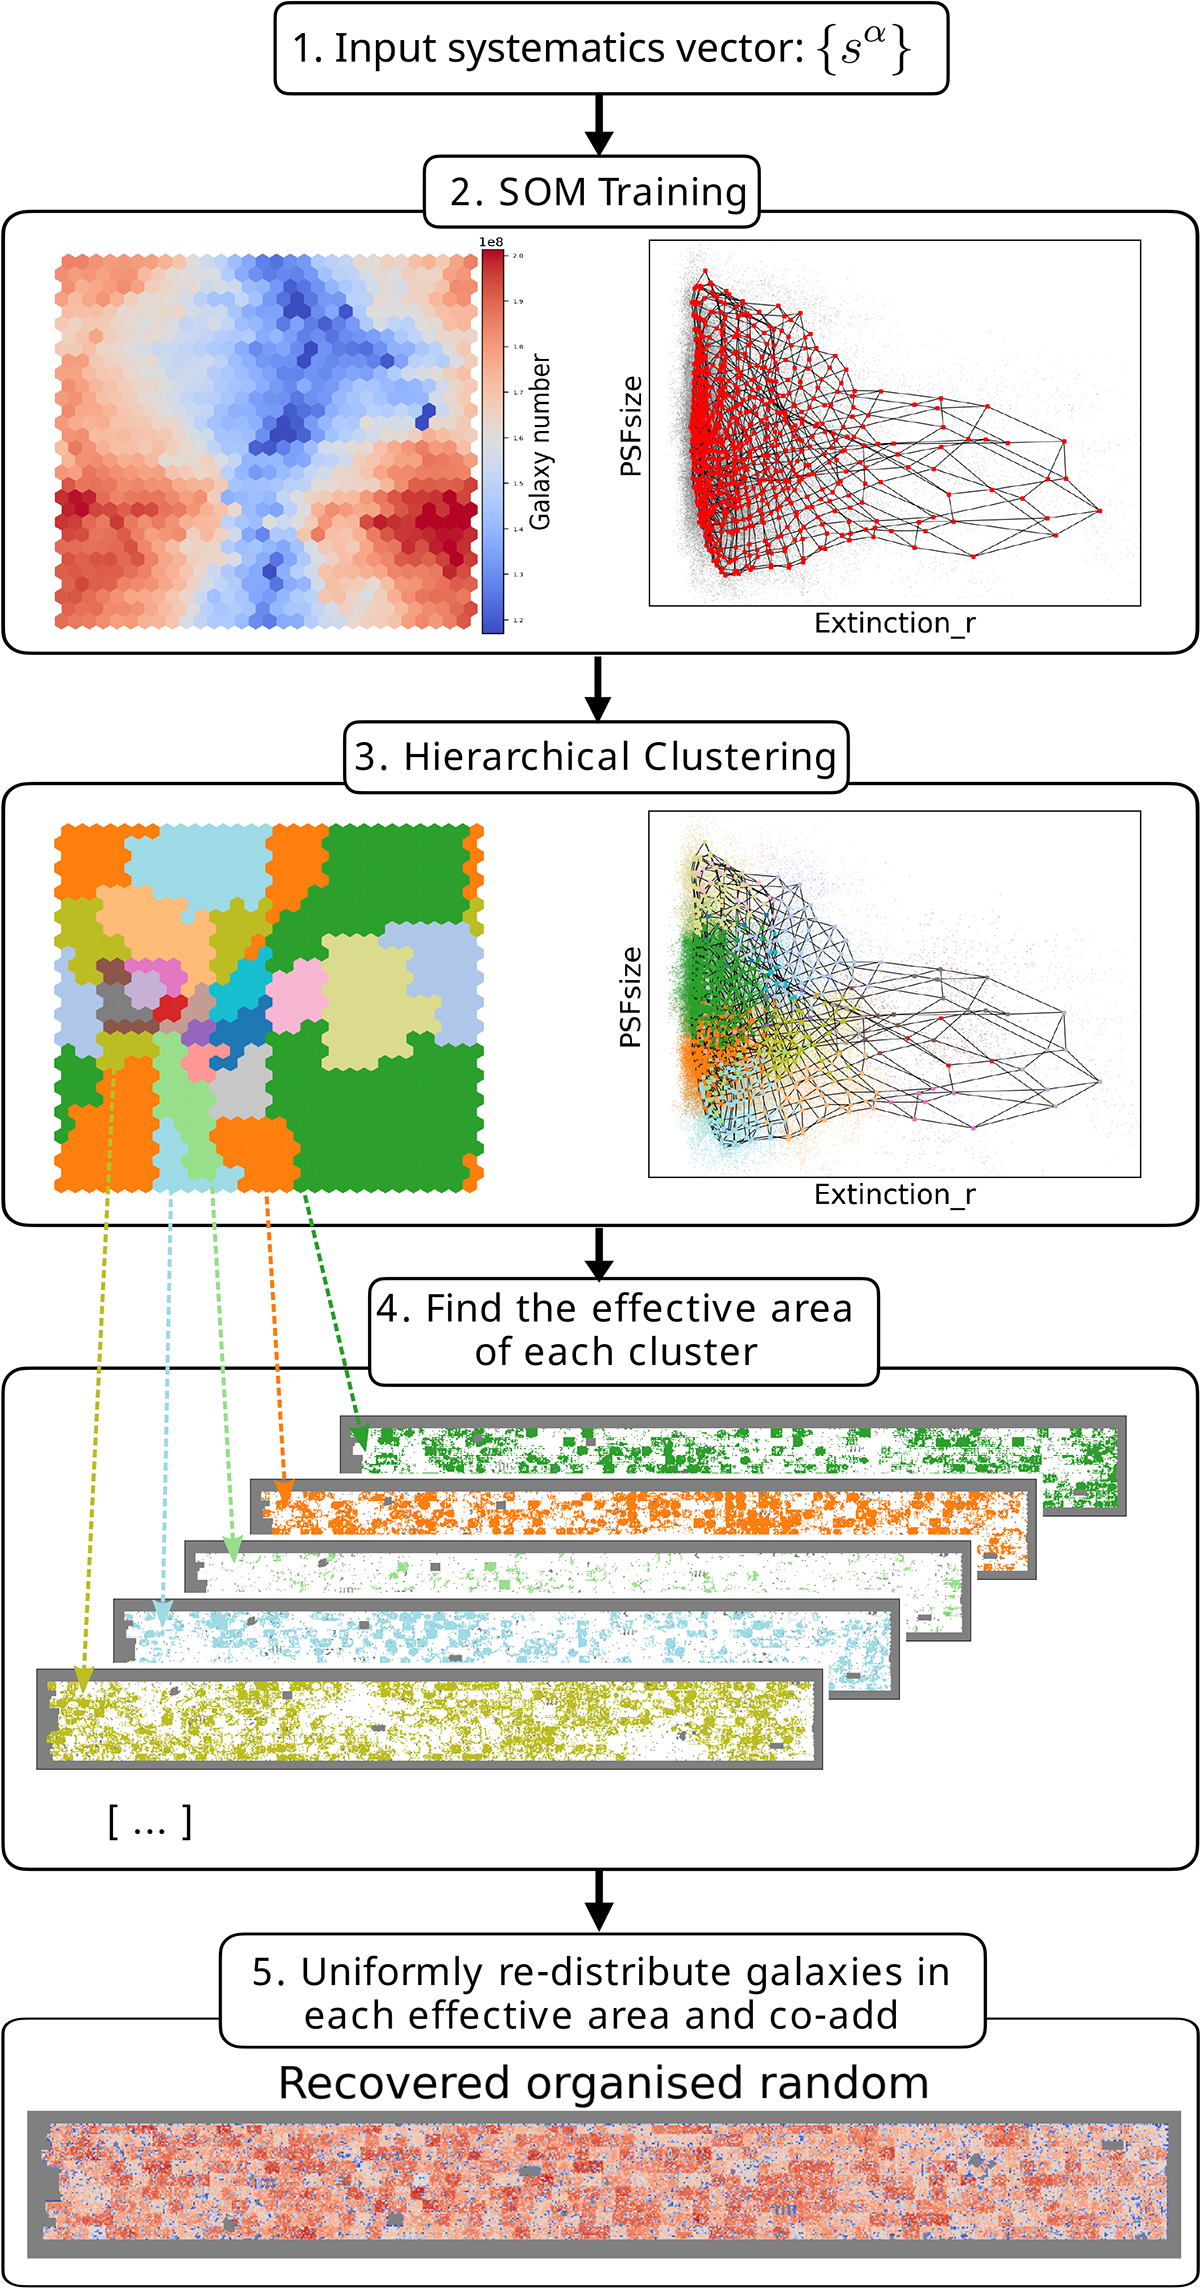
Flowchart illustrating the SOM+HC method to recover OR and correct selection effects in the 2PCF. Starting from the top: 1. Input systematics; 2. SOM training: left panel: SOM grid colour-coded by galaxy number in each cell; right panel: projection of systematics vectors (small grey dots) and SOM cells (red dots connecting) on the plane of two systematics. The projected adjacent SOM cells are connected with black lines; 3. HC output: left panel: SOM cells colour-coded according to hierarchical cluster indices; right panel: systematics vectors and weight vectors colour-coded by corresponding cluster indices; 4. Effective areas corresponding to galaxies from each cluster; 5. Recovered OR weight map which will be used in a subsequent 2PCF measurement.
Current usage metrics show cumulative count of Article Views (full-text article views including HTML views, PDF and ePub downloads, according to the available data) and Abstracts Views on Vision4Press platform.
Data correspond to usage on the plateform after 2015. The current usage metrics is available 48-96 hours after online publication and is updated daily on week days.
Initial download of the metrics may take a while.