Fig. B.1.
Download original image
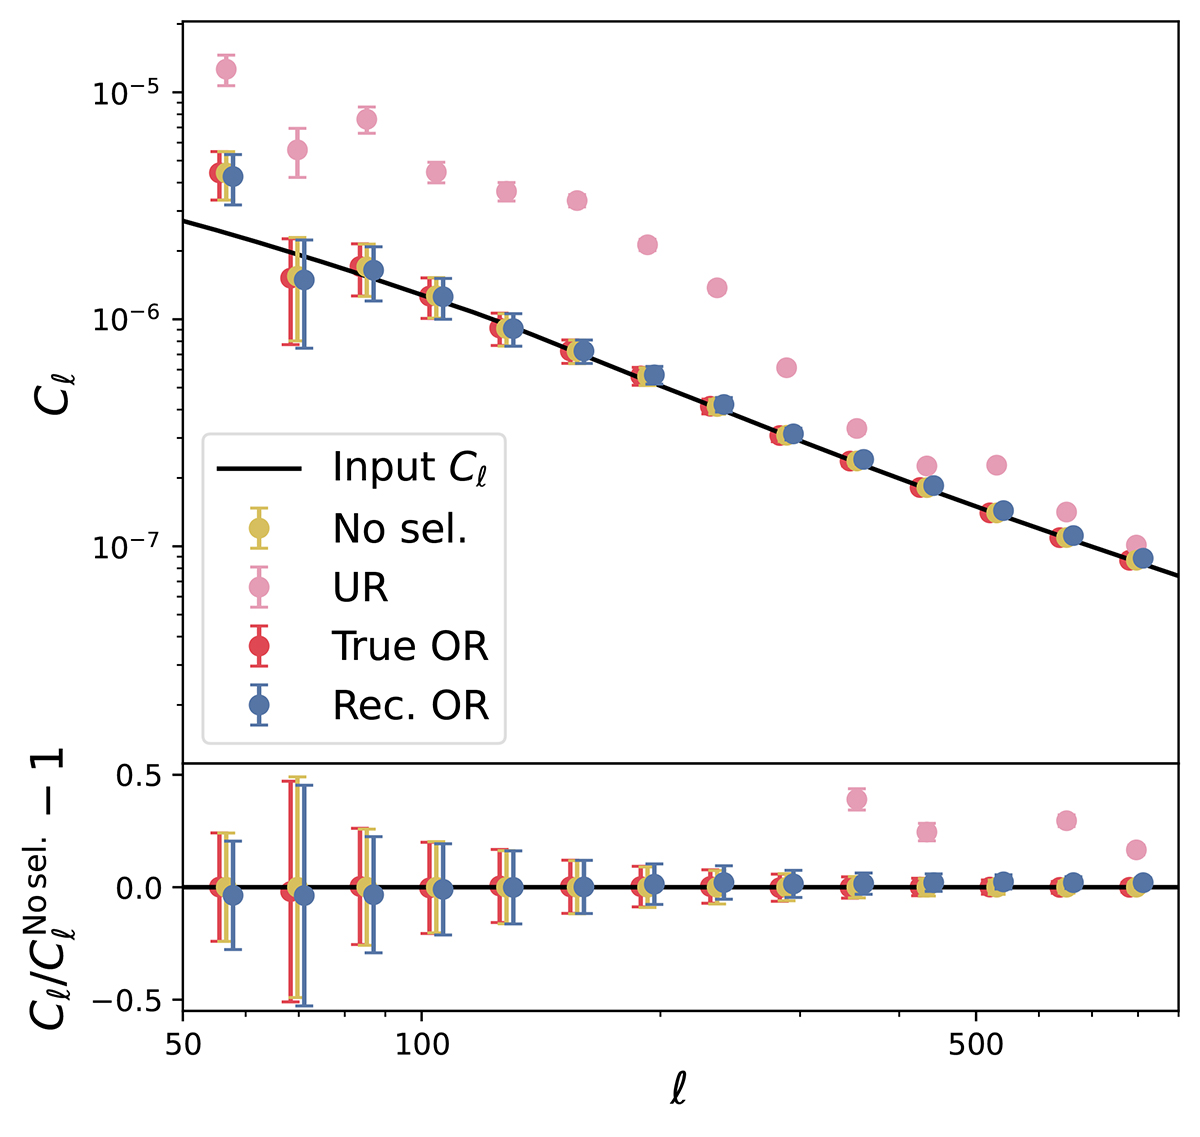
Upper panel: Pseudo-Cℓ measured from GLASS mock samples. The data points of each series are the average PCL from 40 realisations; the error bars are the square root of the covariance diagonal given by NAMASTER. The χd2 values, which describe the difference between each dataset and the No selection PCL, are calculated similarly to Eq. (18). Lower panel: Relative difference of each case with respect to the no selection case. The shaded regions are the ℓ modes corresponding to a physical scale smaller than 8 h−1Mpc estimated at the mean redshift.
Current usage metrics show cumulative count of Article Views (full-text article views including HTML views, PDF and ePub downloads, according to the available data) and Abstracts Views on Vision4Press platform.
Data correspond to usage on the plateform after 2015. The current usage metrics is available 48-96 hours after online publication and is updated daily on week days.
Initial download of the metrics may take a while.