Fig. 2.
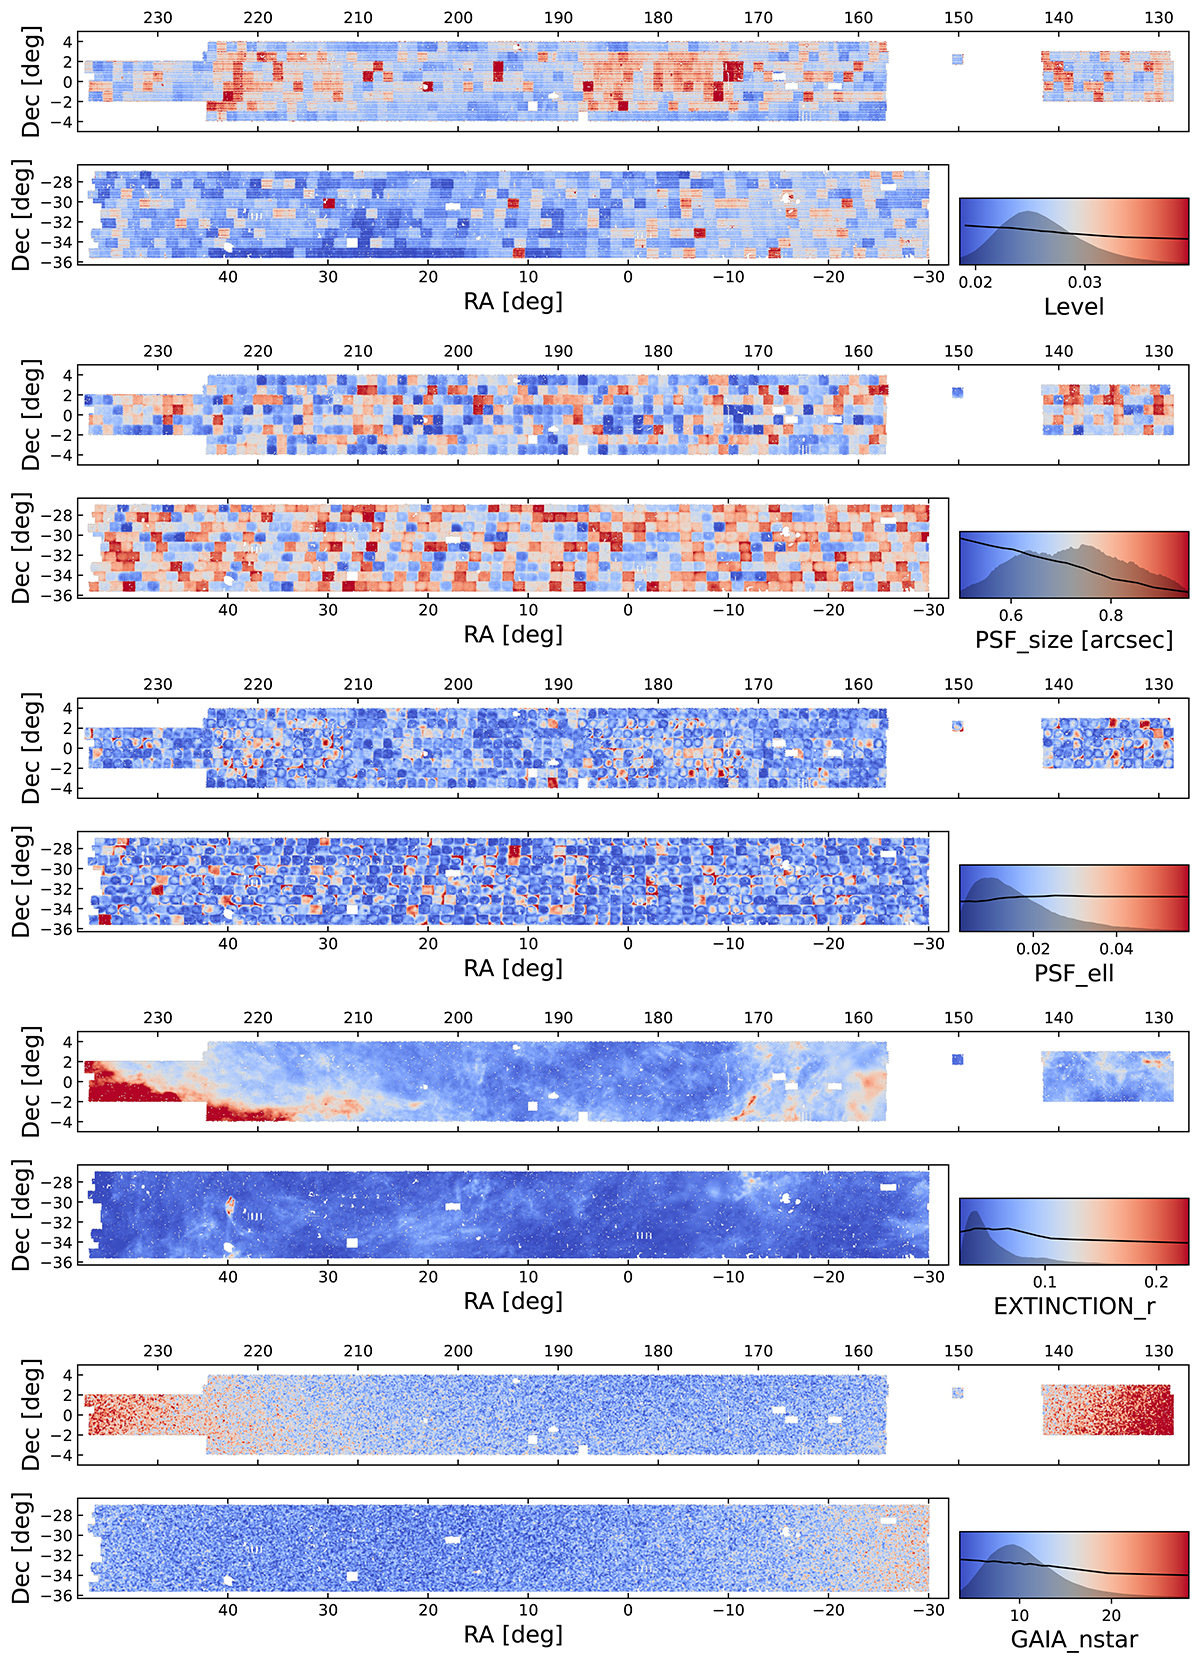
Download original image
Maps of the KiDS-Legacy systematic considered in this paper. Each map is divided into northern and southern fields, plotted together with their colour bars. The black curves over-plotted in the colour bars show the relationship between galaxy contrast and systematics value, and the dynamic ranges are [ − 0.25, 0.25]. The shaded regions show the probability distributions of each systematics.
Current usage metrics show cumulative count of Article Views (full-text article views including HTML views, PDF and ePub downloads, according to the available data) and Abstracts Views on Vision4Press platform.
Data correspond to usage on the plateform after 2015. The current usage metrics is available 48-96 hours after online publication and is updated daily on week days.
Initial download of the metrics may take a while.