Fig. 18.
Download original image
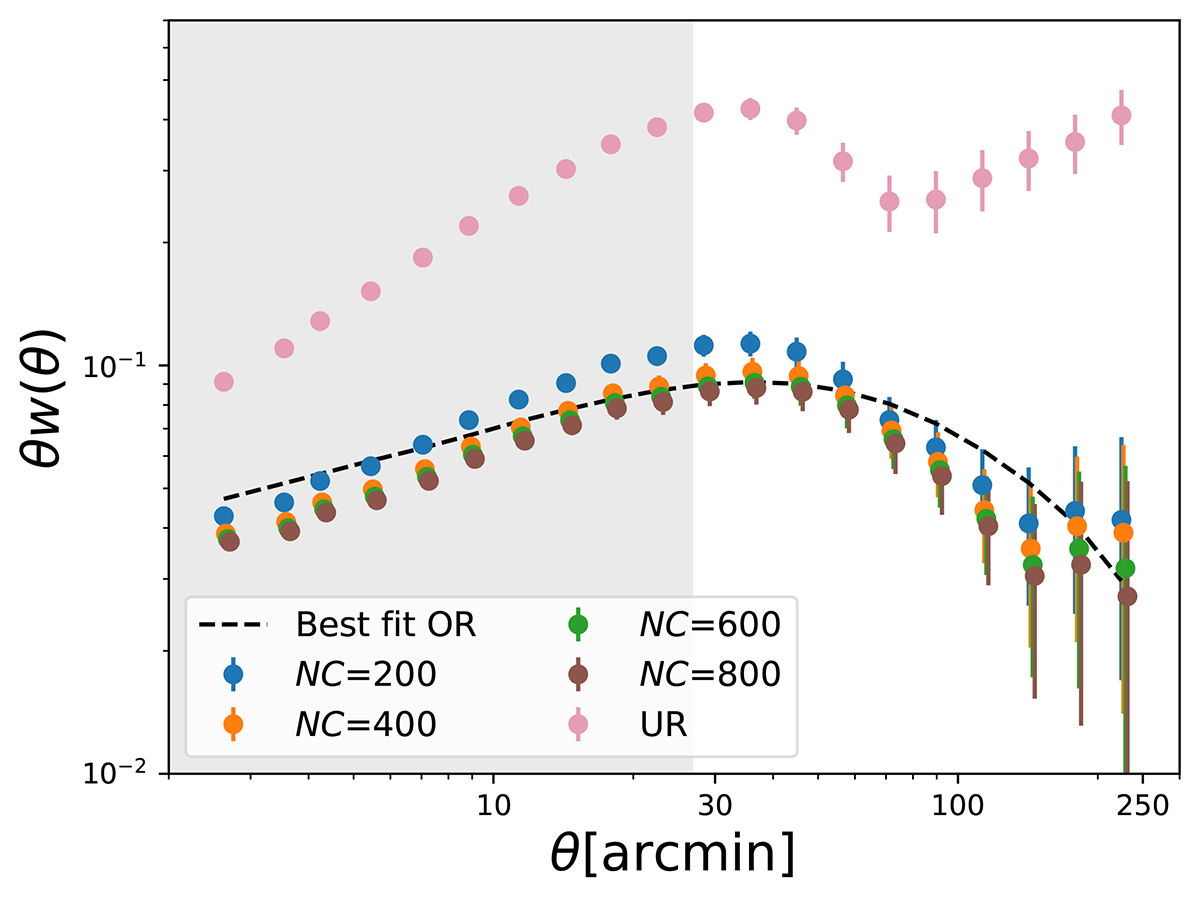
Blinded 2PCFs measured from the KiDS-Legacy sample. The blue and pink dots are the measurements corrected by the recovered organised random and by the uniform random, respectively. The shaded regions are angular scales corresponding to physical scales smaller than 8 h−1 Mpc estimated at the mean redshift. The error bars are the standard deviations derived from the covariance matrix computed by the ONECOVARIANCE code. The black dashed curve shows the best-fit 2PCF from the MCMC.
Current usage metrics show cumulative count of Article Views (full-text article views including HTML views, PDF and ePub downloads, according to the available data) and Abstracts Views on Vision4Press platform.
Data correspond to usage on the plateform after 2015. The current usage metrics is available 48-96 hours after online publication and is updated daily on week days.
Initial download of the metrics may take a while.