Fig. 16.
Download original image
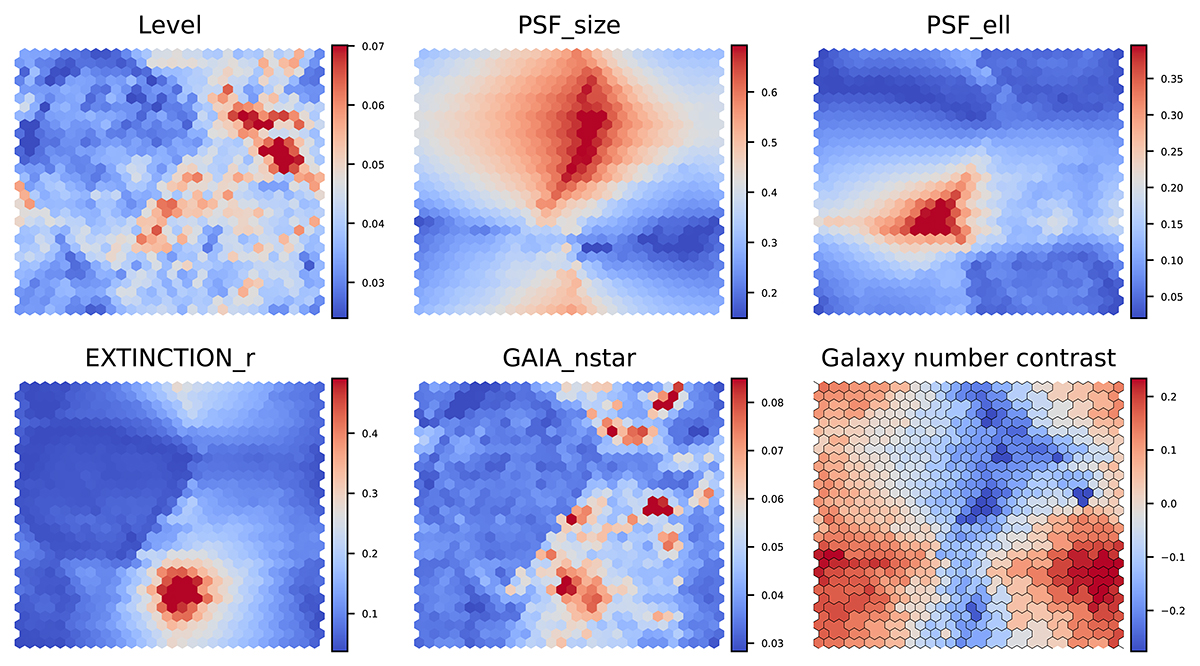
Self-organising maps trained on the KiDS-Legacy catalogue, with the dimension 30 × 30. The first five panels are SOMs coloured by the average systematics values in each cell. The last panel (bottom right) is the SOM coloured by the galaxy number contrast of each hierarchical cluster. The black lines are the boundaries of each HC. We note that we use a toroidal topology for the SOM, so the left and right edges and the top and bottom edges are adjacent.
Current usage metrics show cumulative count of Article Views (full-text article views including HTML views, PDF and ePub downloads, according to the available data) and Abstracts Views on Vision4Press platform.
Data correspond to usage on the plateform after 2015. The current usage metrics is available 48-96 hours after online publication and is updated daily on week days.
Initial download of the metrics may take a while.